The Problem
A large U.S. refinery was struggling to control its water treatment programs. Increasing corrosion rates and scaling issues required monthly heat exchanger cleanings, and operator testing of the cooling, boiler, and reverse osmosis (RO) systems showed they were outside the target operating ranges.
The Solution
The refinery was underutilizing ChemTreat’s water management software CTVista+ by not integrating enough data to show accurate system trends.
The ChemTreat team worked closely with operations management and engineering supervisors to implement the software broadly throughout the refinery. Operators were trained to input data from on-site testing so accurate trends could be generated. ChemTreat provides on-going training to operators to ensure testing procedures are standardized and fine-tuned for the most accurate results.
Additionally, CTSolutions® panels were installed to monitor pH, free chlorine, and conductivity. The controllers feed treatment product based on system data.
The Results
Prior to fully leveraging the CTVista+ software, the customer’s water treatment program was within the target ranges for water treatment parameters approximately 17% of the time. After CTVista+ was implemented across all systems, target ranges were met 75+% of the time without any changes being made to the water treatment chemical program.
The ChemTreat representative who services this facility regularly reviews operator data to troubleshoot issues and monitor key performance indicators.
Based on the success of the program, other refineries managed by this customer are starting to implement CTVista+ as part of their water treatment programs.
The data from CTVista+ has been integrated into the customer’s corporate reporting process, giving company management a direct view of the water treatment program performance at their facility.
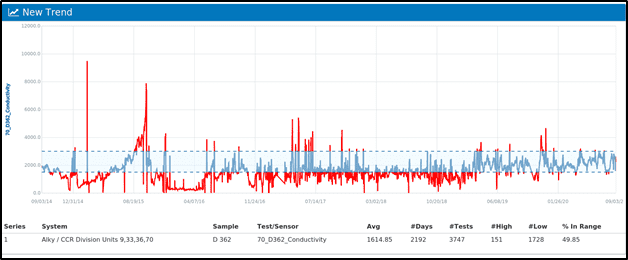
Conductivity Trend Chart from CTVista+
pH Trend Chart from CTVista+
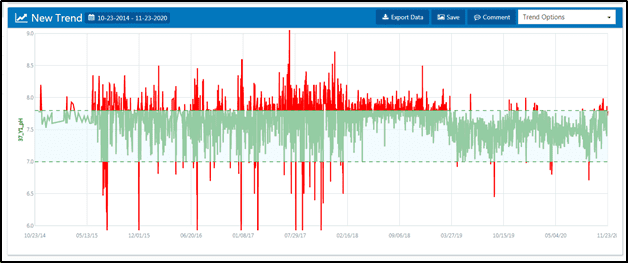
Trend charts showing pH and conductivity testing parameters increasingly staying within the acceptable range after CTVista+ was fully adopted in April 2019. The shaded area indicates the acceptable parameter range.
Results are examples only. They are not guaranteed. Actual results may vary.