What is Pretreatment?
Pretreatment is a broad term used to describe any piece of equipment, chemical, or process used to treat industrial water prior to using it for another purpose. If you have a reverse osmosis (RO) unit, you may need filters upstream to remove suspended solids. If you have boilers, contaminants such as hardness and suspended solids will need to be removed. Water that needs to be discharged from a plant can also require a form of pretreatment before it can be disposed.
Why is Pretreatment Important?
Unfortunately, you can’t just send city water straight to a boiler or discharge wastewater straight into the city’s water supply. This could cause scaling and/or deposition of suspended solids, which can plug up tubes. This may, in turn, require you to feed more chemical, perform more cleanings, and replace your equipment more frequently.
Depending on your system needs, pretreatment systems can get very complex.
Water Sources
When it comes to RO units, there are two different categories of water to consider:
- Brackish water: less than 15,000 total dissolved solids
- Sea water: more than 15,000 total dissolved solids
Total dissolved solids (TDS) are not the only defining factor, however. It is also important to distinguish between surface water, ground/well water, and tertiary/reuse water.
- Surface water: higher concentration of bacteria, suspended solids, dirt, and grit as well as fluctuations in temperature and chemistry based on local weather patterns
- Ground/well water: higher alkalinity, hardness, and potentially iron because this water travels through limestone underground
- Tertiary/reuse water: higher in TDS, total suspended solids (TSS), dissolved metals, and bacteria nutrients like phosphate and nitrogen compounds because this water has likely already been used by the city or plant itself.
Each of these water sources will require different types of pretreatment.
Treating RO Feedwater
Two of the biggest concerns when getting water ready to feed for an RO unit are removing suspended solids down to an acceptable silt density index (SDI) limit and treating the water for bacteria. The RO unit can tolerate a broad range of inorganics, but when levels of heavy metals exceed 0.05 ppm, these will need to be removed prior to the RO.
The makeup of the water can change, so designing a treatment program can pose challenges. Even if you have a well water source with a consistent conductivity rate, the hardness and alkalinity levels can change over time. It is very important to use the most recent water samples as well as more than one sample over a period of time whenever possible when designing a treatment program to ensure you have the right data to make a decision. Many plants neglect any form of SDI or bacteria testing when designing a pretreatment plant, which can negatively impact RO units.
Negative Effects of Poor Pretreatment
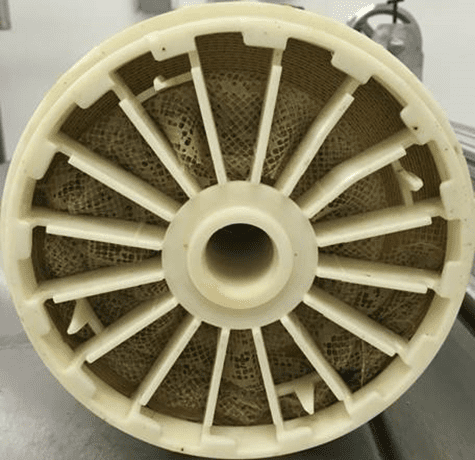
This picture illustrates the negative effects of poor pretreatment. Poor pretreatment can adversely affect your equipment both upstream and downstream.
Six Tips for Optimizing Your Pretreatment
1. Maximize Softener Salt Efficiency
Softeners remove hardness and any other dissolved ions with a positive charge higher than sodium, including some potassium, iron, and heavy metals. It can also act as physical filter and remove some TSS, even though they are not typically designed to do this in the pretreatment process. Everything else passes through the softener.
When the softener exhausts its sodium, the beads need to be recharged with sodium chloride brine.
Three things to look at when determining resin capacity:
- Pounds of salt added per cubic foot
- Cubic foot of resin in vessel
- Total hardness in the water going to the softener
As more salt is added during regeneration, capacity will increase.
lbs. of salt ÷ Kgr/ft3 for capacity = salt efficiency
The increase in capacity is not linear, and you will see a break point for how much salt to use and how much capacity you will get out of that. The ChemTreat team is well-versed in these calculations and can actively work with you to help you optimize your systems.
Be mindful of sodium leakage: the less salt you use during regeneration, the more likely that hardness will leak through.
Many facilities will set their softener regeneration on a timer, but this may not be the best way to achieve water and salt savings. It is important to ensure you are taking control of your system to prevent wasting resources. Also, keep in mind that if your plant has discharge limitations, you may not be able to easily discharge the excess chlorides from the salt, which makes minimizing regenerations even more crucial. It is important to rely on the data and not regenerate the softener unless the sodium is exhausted.
2. Increase RO Recovery
You may think closing the concentrate valve is enough to operate at a higher RO recovery. However, increasing RO recovery tends to be a little more complicated.
Pay attention to your SDI and ensure chemical feeds are correct. Backwashing your upstream ultrafilters or multimedia filters regularly is another important factor to keep in mind. If you are designing a new RO plant, it is vital to consider these issues when looking to increase RO production.
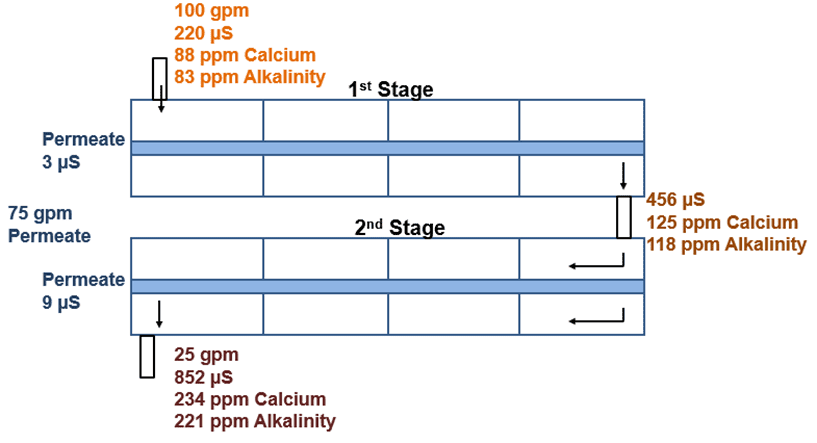
As this diagram illustrates, if we have 100 gpm coming into an RO unit and are operating at 75% recovery, we are creating 75 gpm of filtered water (permeate) and 25 gallons per minute are going down the drain. This is the standard recovery rate that almost all traditional RO systems have been designed around in the past.
However, this rate of water usage is not very efficient, especially if you are focusing on sustainability at your facility. As environmental, social, and governance (ESG) practices around water conservation become more and more prevalent across most industries, 75% RO unit recovery is no longer an acceptable recovery rate for many facilities.
Many of our customers have asked for help retrofitting designs to higher recoveries, installing recovery RO units, and dealing with new technologies like the closed-circuit reverse osmosis (CCRO), which can increase recovery to 90%+.
When looking to increase recovery, it is important to consider scaling potential, ionic loading, and hydraulics.
Difference Between Water Costs for Different Recovery Rates for 100 gpm Feed
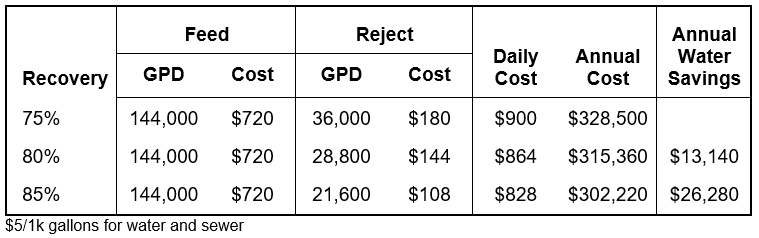
In this example, increasing the recovery rate from 75% to 80% saves $13k in water costs alone. Although the capacity of each facility varies, this shows the potential cost savings you may be able to achieve by increasing RO recovery.
However, before these savings can be realized, it is important to evaluate ionic loading by looking at your water analysis.
Concentration Factor
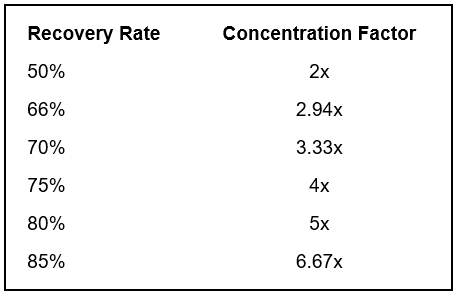
Relationship between RO system recovery rate and the concentration factor of TDS
There is a concentration factor associated with each recovery rate. Whatever enters the RO should concentrate up and leave the unit in the reject stream based on the concentration factor. As the rate increases, so does the amount of TDS being cycled up. If you are running at 3 cycles of concentration at approximately 66% recovery and you want to increase to 4 cycles, the recovery will increase to 75%, a 9% boost at only 1 extra cycle. But if you want to increase from 4 to 5 cycles, the recovery rate only increases by 5% while more stress is added to the system. 90% recovery means going up to 10 cycles. So, if there is 10 ppm of hardness coming in, 100 ppm of hardness will leave the system at 90% recovery.
The higher the recovery rate, the more you need to pay attention to even minor fluctuations in the feedwater quality, as they may cause scaling issues.
Ionic Loading
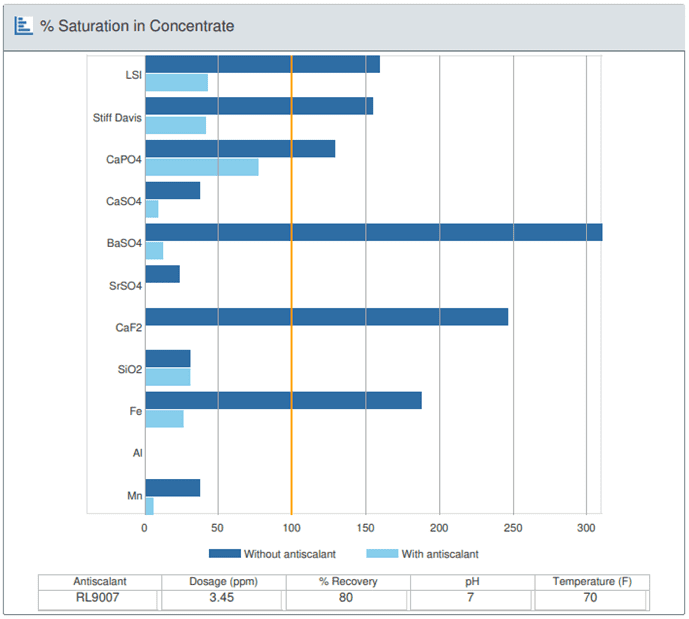
Example from ChemTreat’s RO Configurator, which measures scale saturation levels under certain conditions to provide antiscalant product and dosage recommendations
As this chart indicates, scale should not form if the concentrate saturation is under 100%. Whenever you are looking to increase recovery rates, a new scaling projection should be performed to make sure the antiscalant can handle the new load at the specified pH and temperature. This can also help you calculate how much acid to feed to maintain a new pH target, if necessary, and determine whether the cost of the acid will be less than the projected water cost savings.
Hydraulic Limitations
Hydraulic limitations often get overlooked, and not just when ROs are being retrofitted or recovery is being increased. Our staff has seen many instances of RO systems with a concentrate flow of approximately 4 gallons per minute, when the bare minimum flow for an 8-inch membrane is 12 gallons per minute. Operating like this will create a scaling situation that an ionic projection would not catch or predict.
No matter how much these facilities are controlling their antiscalant and recovery rates, they are still putting their systems at risk of scaling. If the design projection shows the hydraulic limits are outside their design guidelines, scale may form.
Every membrane manufacturer offers a free download of their software for hydraulic evaluation, which points out considerations like the maximum feed flow for various elements, maximum flux rates, etc. An RO unit that uses ultrafiltration as a pretreatment step may be pushed a bit higher from a flux standpoint, whereas a unit using solely a multimedia filter may be more susceptible to suspended solids fouling and therefore more limited from a flux standpoint. The better your pretreatment, the better the flux rates, which means less water going down the drain.
If you are looking to increase the recovery of your unit and conserve water, we recommend running a design projection (or asking your water treatment provider to do so) to better understand your hydraulic limitations on top of the normal scaling projections commonly run when making these decisions.
Reusing RO Reject to Improve Sustainability
There are multiple ways to reuse RO reject in other parts of your system. Some facilities add it to their cooling towers, especially in bigger cooling systems where it can be diluted alongside normal tower makeup water.
RO reject can also be used as rinse water for certain equipment at your plant, as long as it fits the criteria.
There may be other areas where RO reject can be used. You can do a water balance of your system to evaluate potential opportunities.
3. Trend Pressure Drops (dP) Across Individual Stages
Trending pressure drops across the individual stages of your RO system involves adding pressure gauges between the stages, as illustrated in red on the below diagram.
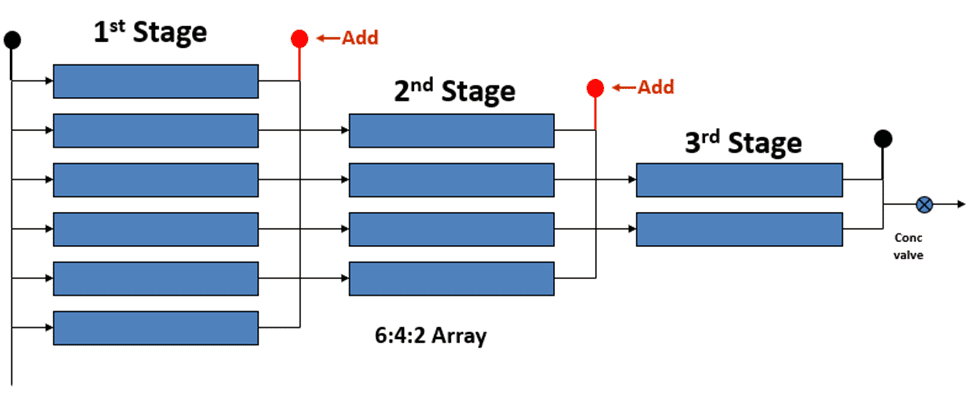
The individual stages refer to the pressure vessels sharing the same feedwater.
Raw feedwater will always hit the vessels in the first stage. These vessels will filter out some water, and the water that does not get pushed through the membrane can be sent to the second stage to increase recovery and so on.
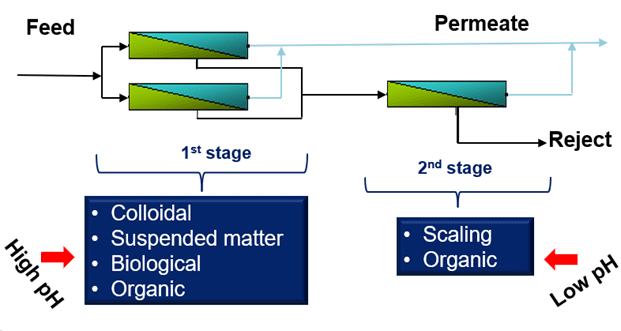
First Stage
The first stage is what typically gets fouled with microbiological, colloidal, organic, and suspended matter (physical fouling). If your pretreatment is stressed and your SDI is high, the first stage will be hit hardest. This means dirt, grit, bacteria, etc. are going to get trapped in those first elements.
It is often recommended to install interstage pressure gauges so you can identify where an issue is happening. Otherwise, when it comes time to troubleshoot, you will need to clean the entire system with multiple products instead of just a portion of it.
Last Stage
The last stage is where scaling may show up. If the recovery is increased or antiscalant feed is lost, the potential for scaling increases. Since the last stage has feedwater with the highest conductivity, this is where scale will initially show up.
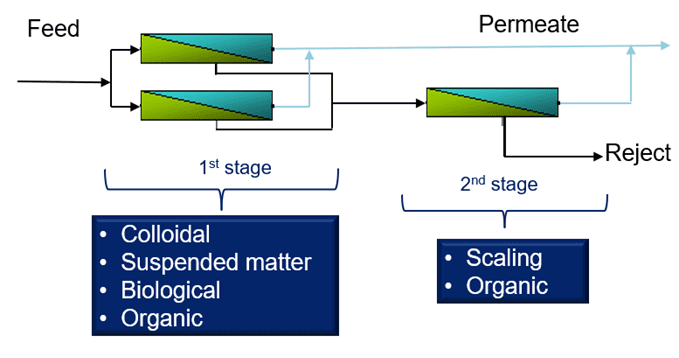
This chart breaks down many of the key issues that affect different stages. Trending pressure drops separately by stage can help you perform more efficient cleanings on your system, reducing chemical and water usage and manpower requirements.
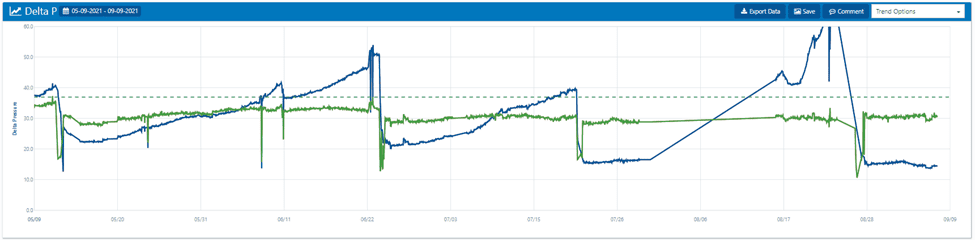
Example of trending pressure drops across different stages
Blue: 1st stage dP
Green: 2nd stage dP
4. Normalize Your Data
Temperature
Many factors affect the function of your RO unit, including temperature. Colder water is denser, which means it requires higher pumping pressures to make the same amount of water as warmer temperatures. The FilmTec™ Reverse Osmosis Membranes Technical Manual specifically states that a feedwater temperature drop of 7°F (4°C) will cause a permeate flow decrease of approximately 10% (DuPont™, 2022, p. 140).
Salinity
As water gets colder, permeate quality may improve because the pores get tighter, reducing salt passage. The inverse is true as the water warms.
Collecting Data for Efficient Cleanings
Like trending pressure drops, collecting temperature, pressure, flow, and salinity data is important to ensure efficient cleanings. If data is normalized, a fouling issue can be distinguished from a change in operation based on temperature fluctuations. This will help you save chemical, water, and manpower when it comes to performing clean-in-place (CIP) procedures.
There are many trending tools available for data normalization. ChemTreat offers this capability as part of CTVista®+, our intelligent water management software. Using automated software means less time spent sorting through raw data and improved data analysis for effective and informed decision-making.
If you see a 10–15% change in your normalized permeate flow, it may be time for a cleaning. Waiting too long before cleaning may impact the health of your RO membranes and even cause mechanical damage, so it is important to use your normalized data as a reference point. Your cleaning schedule will vary based on what kind of water you use and what contaminants are entering your system, so using a standard or preventative maintenance approach can cause you to fall behind on cleanings and lead to premature membrane replacement.
5. Improve Cleaning Practices
Since foulants vary by stage, different types of cleaners are needed for the different stages.
High-pH Cleaning Process
High-pH cleaners provide good results when targeting suspended matter, bacteria, and organics that tend to show up in the first stage.
The steps below provide a general overview of the cleaning process. However, it is crucial to follow the membrane manufacturer guidelines closely.
1. Prepare X%* solution of high-pH cleaner at a pH of 11.8–12.0 and a temperature of 100°F
2. Flush first 20% of solution through membranes to the drain
3. Circulate and soak remaining solution at 15-minute intervals for 2–3 hours, maintaining pH and temperature (flow for 8-inch membranes is approximately 40 gpm per pressure vessel)
4. Monitor pH levels every 15 minutes and add caustic if a pH decrease of greater than 0.5 is recorded (if you have high organic loading, you may want to flush caustic through your system before the cleaning to clear out some of the heavier fouling; caustic tends to be cheaper than specialty cleaners and adding this step may save you some money as opposed to using two batches of high-pH specialty cleaner)
5. Discard and flush thoroughly with good-quality, chlorine-free water (rinse until permeate pH is 7.5)
*The % solution will depend on the product you are using and the recommendation of your water treatment provider.
Low-pH Cleaning Process
Low-pH cleaners work well for the scaling issues that may arise in the second stage. If you are performing a low-pH cleaning right after a high-pH cleaning, it is important to rinse out the system first to maintain a neutral pH and a permeate conductivity of less than 100.
The procedure for the low-pH cleaning is similar to the high-pH. However, heat is not typically added because the goal is to remove scale.
If your cleaning solution turns a dark, opaque color (high-pH cleaning) or orange and turbid (low-pH cleaning), it needs to be dumped and a new solution started.
Why Can’t I Just Use Caustic?
Boosting the conductivity of your CIP solution with a specialty cleaner can have more benefits than just using surfactants, wetting agents, buffers, etc. For example, if we have a caustic solution with a pH of 12, conductivity is approximately 3,000 µs, which converts to approximately 1,950 ppm of total dissolved solids. For every 100 ppm of TDS, you have one osmotic pressure, so, in this scenario, we have 19.5 psi pushing back against the pump pressure being used for the CIP.
Typical CIP pump pressures operate at approximately 60 psi. By using caustic instead of a specialty cleaner, the pump pressure can overcome the osmotic pressure, making permeate, which is potentially holding down a lot of dirt, grit, and bacteria that you’re trying to get rid of instead of boosting the crossflow, which is the goal of a CIP. Adding a specialty cleaner will increase conductivity to approximately 10,000+ µs, which will boost osmotic loading to over 60 psi and provide a lot of turbulent crossflow to scrape away the foulants.
6. Consider New RO Membrane Technology
Low-Energy Membranes
Low-energy membranes produce the same amount of permeate flow at approximately 150 psi compared to standard membranes, which are tested at approximately 225 psi. This means low-energy membranes produce the same amount of water while using less energy to do so.
This capability means you can use a smaller feed pump to save on operating costs and capital expense. However, if you do design your system around low-energy membranes, it is important not to substitute in standard membranes, as this will cause system issues.
Low-energy membranes significantly reduce pumping energy, which will help you save on operating costs. They also perform better in areas with low feedwater temperatures, though you may see a slightly lower permeate quality.
One example ChemTreat was involved in saved a plant 42% in energy costs by switching to a low-energy RO membrane that only cost $10 more than the standard equivalent.
Closed Circuit Reverse Osmosis (CCRO) and Other High-Recovery RO Units
There are three important factors to consider if you are thinking about installing a CCRO at your facility:
1. Volumetric Recovery
While traditional RO units operate at a constant standard recovery rate, CCROs use volumetric recovery. Standard recovery means that for every minute the unit is running, the same flow of water is being filtered and also sent to drain.
For example, a 100-gpm unit operating at 75% standard recovery sends 75 gallons of water to the filtered water tank and 25 gallons of water to drain every single minute the unit is running.
Volumetric recovery takes time into account. So, for the same 100 gpm unit operating at 75% recovery, the unit is sending 100 gallons of water to the filtered storage tank for approximately 15 minutes and then sending 500 gallons of water to the drain after that time is up. This recovery takes total flow produced / (total flow produced + flow to drain) x 100 to get its recovery.
In the example, 1,500 gallons of water are being produced with 500 gallons going to drain. This means the volumetric recovery would be 1,500/2,000 x 100 = 75% recovery. This is important when designing these systems because cycle time plays a large role in what recoveries can be achieved. If the RO unit cannot run for longer than 15 minutes without shutting off, a recovery higher than 75% cannot be achieved.
When considering recoveries over 90% where cycle times can be 30 minutes or more, make sure there is adequate permeate storage to allow the unit to run this long without interruption.
2. Water Chemistry
Traditional RO systems take scaling and high hydraulic limitations into consideration. For CCRO, you really only need to consider scaling. You will need to work closely with your chemical and equipment providers to make sure you are feeding the right amount of acid to control scale. Verify the information from your equipment company with your water treatment provider so they can select the correct antiscalant and adjust pH if necessary to help meet the specified recovery.
3. Automated Trending
CCROs and other new high-recovery RO units can be very digitized and automated. Unlike with standard ROs, operators may have a hard time monitoring these because they cannot walk up to the system and fill out a log sheet to gather data. Trending CCRO data can be a little tricky, but your water treatment provider can help you gather meaningful metrics from the system.
Final Thoughts: The Importance of Regular Maintenance for Pretreatment
Maintaining your RO system is just as important as its design.
We recommend the following maintenance procedures to improve the life of your system and the quality of your water. Always consult equipment manuals and guides for proper guidance.
- Backwash or change out upstream filters based on pressure drop, not on a timer
- Perform chemical cleanings on your pretreatment filters and/or replace media as needed over the years
- Remember: piping can get just as dirty as filters and RO units, so be mindful of where the issue is really happening
- Inspect systems annually, don’t wait until there is an issue!
Always remember: many factors contribute to the efficiency of your pretreatment and RO systems. As with all other technologies, due diligence is necessary when determining the feasibility of utilizing new methods. Always consult your equipment manuals and guides and reach out to our experienced team for assistance!
References
DuPont™. (2022). FilmTec™ Reverse Osmosis Membranes Technical Manual. Retrieved from: https://www.dupont.com/content/dam/dupont/amer/us/en/water-solutions/public/documents/en/RO-NF-FilmTec-Manual-45-D01504-en.pdf.