-
USA - English
- Locations
- SDS Access
- CTVista®+ Login

Reverse osmosis may be an integral part of your water treatment system, but do you know the early warning signs of problems that could impact your RO unit’s operational efficiency? An overlooked RO may cause fouling and scaling issues, requiring costly cleanings or even expensive replacements and downtime.
When operating and maintaining reverse osmosis units in a pretreatment system, there are three key performance indicators (KPIs) to keep in mind:
However, not all RO systems are built the same. Each manufacturer has specific guidelines for managing their RO units.
Some operators incorrectly believe their RO units should be cleaned every 3–4 months, but RO manufacturers have differing recommendations for their systems. The parameters for cleaning are outlined below by manufacturer.
All manufacturers listed above offer free, downloadable manuals and technical bulletins on their websites. For more detail, please refer to their official websites. Please note this list of manufacturers is not exhaustive.
Sometimes, these guidelines are not followed because upstream pretreatment and filtration systems are not maintained properly, resulting in the need for weekly RO cleanings.
When RO parameters aren’t recorded and trended on a regular basis, tracking performance issues becomes difficult. Without proper data trending, permeate flow is only observed when it begins to drop or conductivity increases.
Many operators will wait until they experience a ΔP increase of 40–50 psid across a single stage before initiating a cleaning. Such a significant pressure increase often leads to channeling, where gaps from suspended solids, colloidals, and bacteria pack into the RO. These gaps restrict flow through the unit, creating a flow of least resistance during cleaning.
We recommend using manufacturers’ guidelines to establish targets for normalized permeate flow, ΔP, or permeate conductivity increases.
When ΔP increases, it is time to start scheduling maintenance and cleaning procedures.
Monitor ΔP across each stage, not the entire RO
Carefully monitor the first stage if using surface water as makeup. Colloidals passing through into the cartridge filter will cause a ΔP increase into the RO.
If the first stage is experiencing buildup, take an SDI pad and allow it to run until it plugs off.
Send the SDI pad with a couple drops of permeate water to your water treatment provider for a scanning electron microscope and foulant identification to help identify pretreatment issues.
Temperature
Free Chlorine
Microbiological Fouling
Feedwater Conductivity and Turbidity
Many RO makeups have two or more streams with different influent conductivity. Use of an on-line conductivity meter allows you to monitor the incoming conductivity to better predict the impact on the permeate. We recommend trending RO conductivity as a best practice for maintaining your RO.
Proper monitoring of an RO system enables operators to know where fouling will occur and what cleaner to use.
RO manufacturers offer free downloadable trending software, but a spreadsheet can also be used to record and trend data.
A flow meter on the permeate, between the first and second stage, allows for individual trending and targeted cleaning of the two stages.
A first stage ΔP is indicative of biofouling, colloidals, suspended solids, or organics. A second stage ΔP increase mainly indicates scaling.
High-pH cleaners are recommended for high first stage ΔP. Anything not properly treated in the first stage will be pushed into the second stage of the RO. However, if the correct antiscalant is selected to match the incoming chemistry and the recovery rate does not change, scaling should not typically occur.
Monitoring cartridge filters and changing them out regularly are important steps that often get overlooked. If any sand, particles, or grit are found on the outside of the cartridge filter elements, something upstream has been breached from one of the bottom laterals or a vessel flange that needs to be corrected.
When opening RO membranes, contaminants from the softener, anthracite, or multimedia may be found in the lead element. These cannot be removed with cleaners and must be flushed out through the bottom drains of the cartridge filter housing.
Both cartridge filter drain valves (as pictured below) should be opened when changing out cartridge filters.
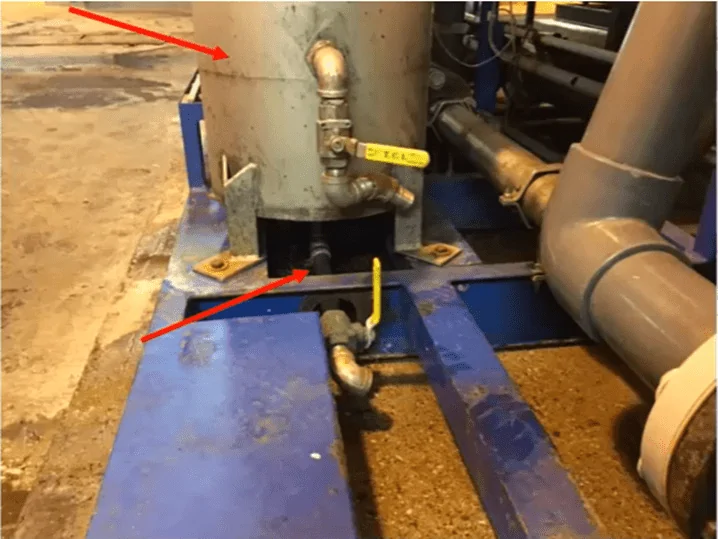
The bottom drain valve should be installed in an easily accessible location. If these are not flushed, foulants will be sent to the bottom compartment and into the lead membrane.
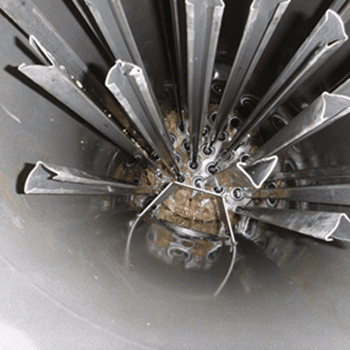
A plant was experiencing consistently high ΔP. In the photo below, there is brown debris built up at the base of the stay rods, around the holes meant for filtered water. Any debris not flushed out of the cartridge filter housing will be pushed into the bottom compartment and the lead element. When this happens, it is very difficult, if not impossible, to remove what is lodged into the face of the lead membrane with RO cleaning chemicals.
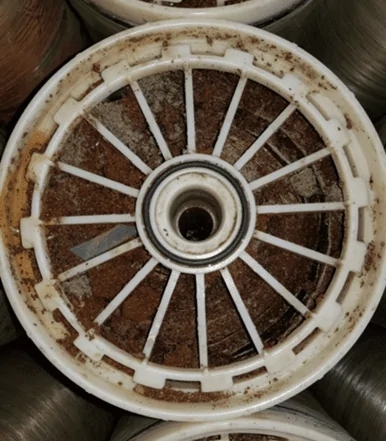
Notice the wide gaps in the membranes below. These were caused by colloidal and particle fouling. Once a gap of any size develops, a flow of least resistance is created, preventing proper filtration or cleaning.
Cartridge filters offer a window into RO operations and are the last means of defense against filtration issues. Let your eyes and your nose be your guide. If something does not look right, report it. If you observe an odor, feel any slime, or notice grit, start to look upstream for the source of the issue and correct it.
Monitor conductivity in the feed, permeate, concentrate, or reject.
Sample all ions frequently. What comes in, must go out or be rejected. For example, if running at 75% recovery, everything coming in should be cycling up four times; if there is 100 ppm calcium coming in, there should be 400 ppm going out.
Measure and record the flow of feed, permeate, and concentrate or reject.
Monitor pressure in the feed, interstage, concentrate, and permeate.
If there is not a pressure gauge in the interstage, see if it is feasible to have one installed. This will act as an indicator for the first stage, where most RO fouling occurs.
Measure the pressure in the concentrate.
Keep an eye on feed temperature, pH, and ORP.
Understanding the conditions of all RO stage flows and ΔP allows for proper cleaner selection and targeted cleaning.
Enter all RO readings into a spreadsheet for trending purposes or download the trending software from your RO manufacturer.
The first stage experiences the highest flow rate and the lowest incoming conductivity. As a result of the high flow rate, the first stage is prone to bacteria, colloidals, suspended solids, and organics. Coagulant fouling may also occur. High-pH cleaners are used in this stage to mitigate these issues.
The second stage has the highest conductivity. Carbonate, sulfate, hydroxide, and phosphate scaling may occur in the second stage. Low-pH cleaners are paired with the proper antiscalant for second stage cleaning. The exception is silica scale, which necessitates a high-pH cleaner.
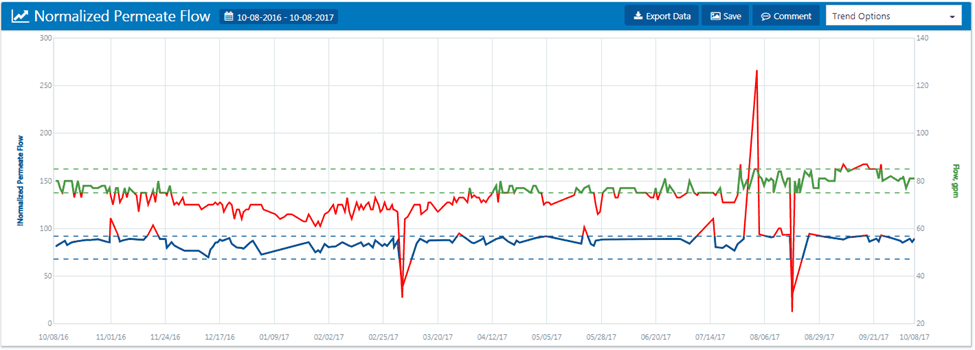
There are two trend lines in the below graph.
The blue line indicates normalized flow, which is a relatively straight line. The peaks and valleys are called “fat fingers,” caused by operators mistyping data points and creating outliers.
The top line trends permeate flow. While the permeate flow fluctuates during normal operation, it may indicate the need for cleaning.
When considering the normalized line, note whether the flow remains within its standard limits. If it does, the RO does not need to be cleaned. Normalized trending also accounts for temperature fluctuations.
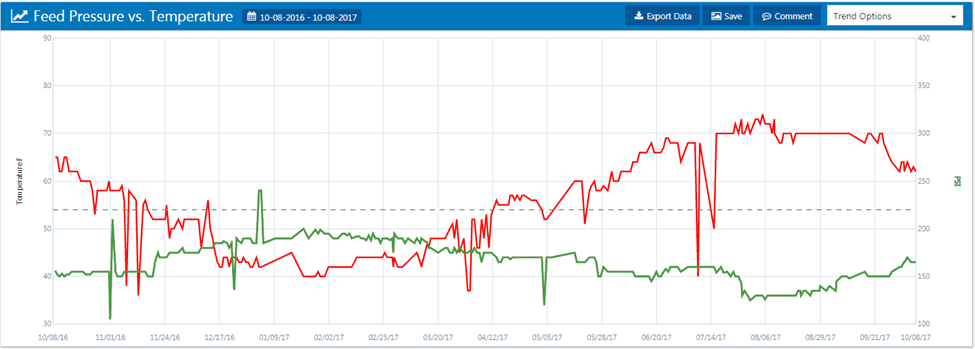
In the graph below, the red line indicates feedwater temperature, and the green line indicates pump pressure.
As feedwater temperature decreases, RO pressure increases because of water’s increased viscosity. More importantly, the membrane pores begin to tighten up in cooler temperatures, causing pumping pressure to increase and permeate conductivity to decrease slightly.
According to the DuPont FilmTec RO manual, page 130, “if you wait too long, cleaning may not restore the membrane element performance successfully. In addition, the time between cleanings becomes shorter as the membrane elements will foul or scale more rapidly.”
If an RO is not taken out of service and cleaned in a timely manner, channeling or gaps may develop, and cleaning may no longer restore the unit’s baseline. It is very important to monitor trends and clean ROs when necessary.
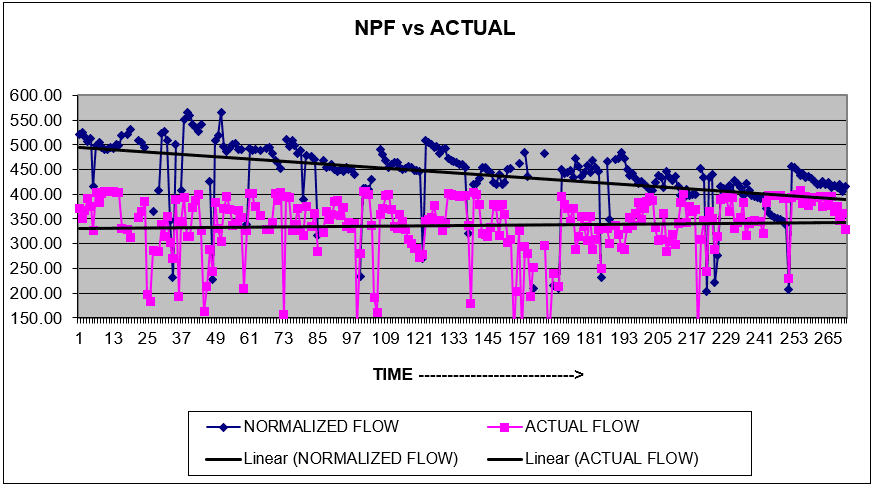
The above shows a very good example of normalized versus permeate flow. The trend lines appear rather busy; however, the dark blueline of the normalized permeate flow is slowly falling and never returns to the baseline. This indicates the operator has waited too long to clean the RO.
It is important to be proactive when noting a downward trend. In this example, operators should set up the clean-in-place (CIP) and schedule a cleaning. Otherwise, the membranes will eventually need to be replaced.
In the schematic below, the blue bar represents the membrane sheet, and the brown circles represent the feed spacer. As feedwater flows through the RO, colloidals and bacteria will become packed in the feed spacers. Bacteria excrete polysaccharides, which will attract and trap colloidals and suspended particles that are difficult to clean out.
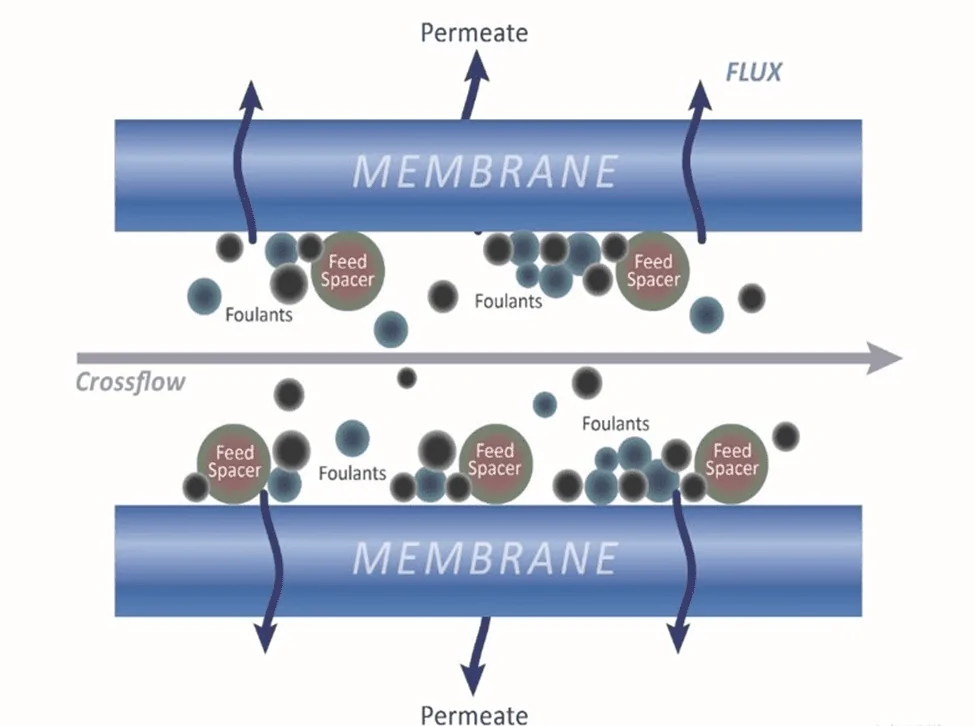
These trapped foulants require a more aggressive cleaning treatment or a very high-pH cleaner to treat. The more the ΔP is allowed to increase, the more difficult cleaning becomes.
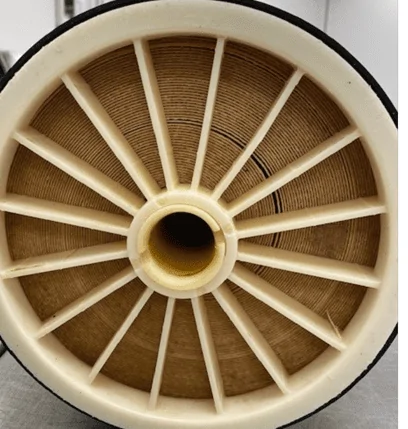
Notice the two narrow crescent-shaped gaps in the membrane above. Once a gap forms, they are permanent and cannot be undone. Service flow and cleaning chemicals will follow the path of least resistance through these gaps, making cleaning more difficult.
In some instances, the gaps become so enlarged that the ΔP will increase and then plateau, so there is no more ΔP building up in that membrane. When this occurs, the areas without water passing through will become stagnant, causing a virtual dead zone.
The following best practices are recommended for maintaining RO efficiency.
If temperature decreases, the ΔP and pump pressure will increase because the membrane pores are going to tighten up. That does not mean cleaning is required in this instance. Look at the normalized data.
The more data is gathered and trended, the easier troubleshooting RO issues becomes. Data collection and normalization enables operators to schedule cleanings and ensure the necessary manpower, chemicals, equipment, etc. are available.
Monitoring these six key areas of the RO provides operators with the necessary understanding of how the three KPIs are trending, indicates the conditions impacting the RO, and helps avoid RO autopsies.
As with all technologies, due diligence is necessary for determining the feasibility of utilizing these methods. Always consult your equipment manuals and guides and seek guidance from your water treatment provider to address your specific system needs.
References
 Meet the Expert:
Director; Filtration, Ion Exchange & Membrane Technologies
Ed Sylvester started working in water treatment in 1976 while serving in the U.S. Navy. As Director of Ion Exchange and Membrane Technologies at ChemTreat, Sylvester has received company recognition for his involvement in energy savings projects and his support of customers in the ethanol, hydrocarbon, chemical, and middle market industries. His areas of expertise include pretreatment (membrane filtration, ion exchange, and clarification) and high-pressure boiler treatment.