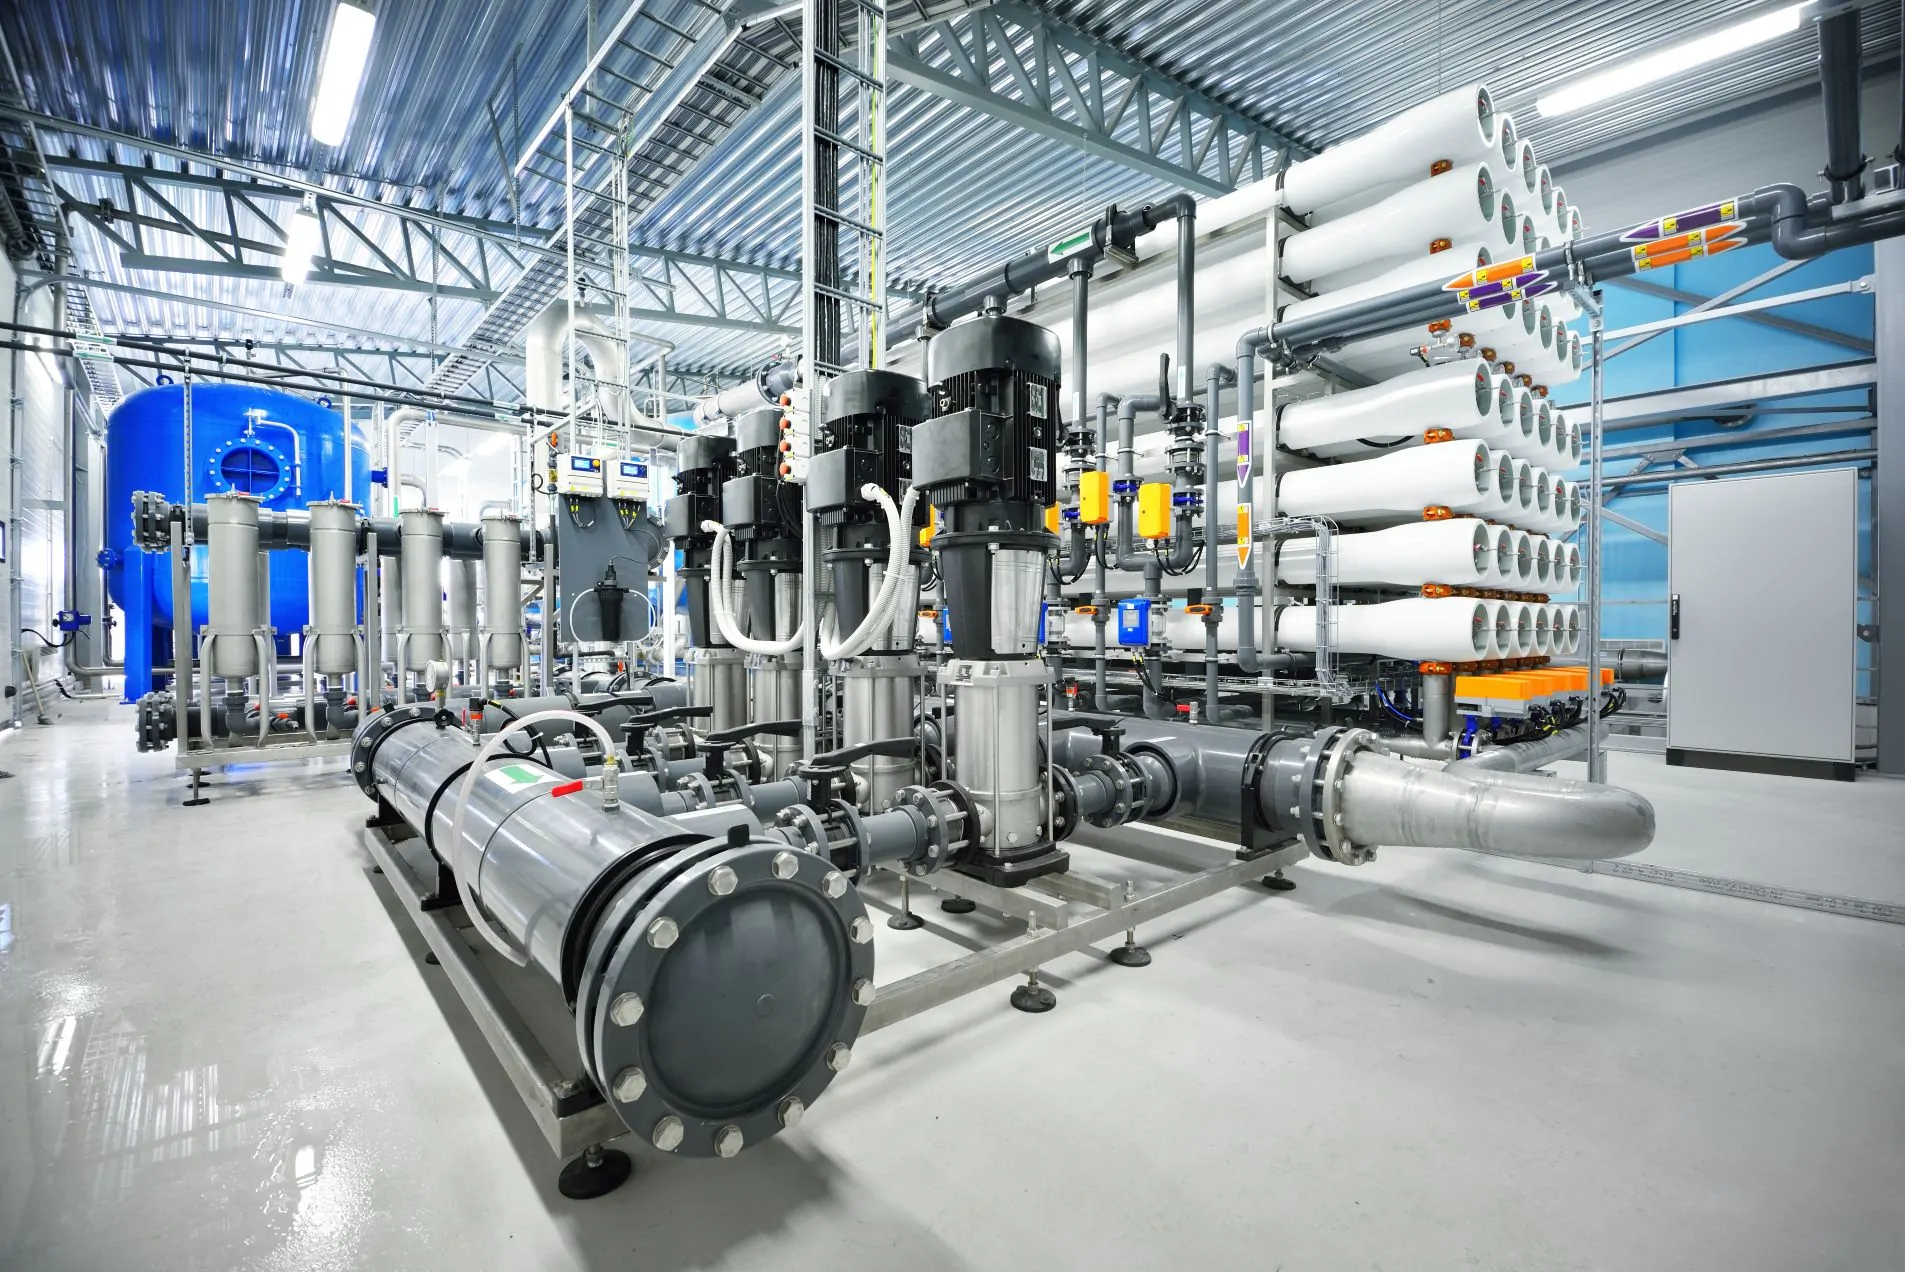
While applications such as cooling tower makeup or service water for washing plant infrastructure may be straightforward, other applications require high-purity water.
This chapter examines pretreatment methods used to refine raw water and reduce the potential for downstream corrosion, scaling, and fouling in facilities requiring high-purity makeup, such as utility steam generators, semiconductor manufacturers, and pharmaceutical plants.
An Overview of Primary Raw Water Sources and Impurities
The following section provides a brief look at the principal characteristics of common raw makeup supplies, followed by an overview of the primary impurities in these supplies.
Surface Water
Water collects particles of sand, soil, and other debris, including organic material and microbes as it flows along the earth’s surface. The physical and chemical characteristics of any surface water supply will fluctuate considerably over time. For example, large changes in suspended solids are common in river supplies following heavy precipitation. Screening for large debris, clarification/filtration, and biocide treatment to control microbiological fouling are typically required to remove suspended particulates from surface water prior to downstream use. Activated carbon filtration may also be necessary for supplies that have high concentrations of dissolved organics.
Groundwater
Many groundwater supplies are essentially free of particulates, organics, and microbes, as they are removed when the water passes through soil and rock formations. While groundwater chemistry and temperature tend to be stable, the concentration of dissolved solids varies depending upon the depth of the aquifer and the chemistry of the formations through which the water passes. Groundwaters may have elevated levels of hardness, bicarbonate alkalinity, silica, heavy metals such as iron, and even hydrogen sulfide, depending upon location.
RO Makeup Water Sources: Addressing Variable Water Quality to Maintain System Efficiency
There are several major impurities commonly found in surface and groundwater, including:
Alkalinity: A major difficulty with alkalinity is its reverse solubility with calcium as temperature increases.
Ca2+ + 2HCO3– + heat → CaCO3↓ + CO2↑ + H2OEq. 2-1
The precipitate, calcium carbonate (CaCO3), has been the most problematic scale-forming compound in cooling water systems and heat exchangers for decades. This scale commonly develops in home plumbing, and it is often incorrectly referred to as lime scale CaCO3 formation can also occur in the downstream elements of reverse osmosis membranes because of the continually increasing calcium and bicarbonate concentrations in the reject stream.
Aluminum (Al): Aluminum is often present in raw water suspended particulates and is removed by mechanical filtration. However, aluminum salts are commonly used as coagulants for clarifiers upstream of reverse osmosis (RO) units. Carryover of excess coagulant feed can cause severe fouling of RO membranes. Aluminum concentrations as low as 50 parts per billion (ppb, approximately equivalent to 0.050 mg/L) may result in a decline in performance.
Ammonia and Other Nitrogen Species: Ammonium ion (NH4+), nitrite (NCO2–), and nitrate (NO3-) often exist in surface water supplies in small concentrations because of biological activity and the breakdown of organic nitrogen compounds. At plants utilizing POTW effluent for makeup, higher concentrations of nitrogen compounds are often present. The nitrogen species are very soluble and do not form scale deposits, but they do provide nutrients for microbes, which can cause fouling in cooling water systems, RO membranes, and other locations.
Barium: barium is present in some well waters, with a concentration range typically below 0.05–0.2 ppm. The greatest concern is that barium can form a hard sulfate scale in RO membranes, particularly in trailing elements. This deposition reaction is very slow, however, and can be controlled with the proper antiscalant. Barium that has been removed in the cation exchange unit of a demineralizer may become problematic during regenerations with sulfuric acid. BaSO₄ deposits can be difficult to remove.
Chloride (Cl): Chloride exists in nearly all natural waters, but concentrations are elevated in brackish supplies. Chloride compounds are very soluble, but the chloride ion can be corrosive, particularly to stainless steel. Even relatively small chloride concentrations in high-pressure steam generators can be problematic, necessitating high-purity makeup water production for these units.
Fluoride (F): Fluoride exists naturally at low concentrations in some well waters but may reach concentrations of up to 2.5 ppm in fluoride-treated municipal water. Calcium fluoride (CaF₂) and sodium hexafluorosilicate (Na₂(SiF₆)) can cause scaling in certain RO applications.
Hardness: Calcium and magnesium are the primary hardness ions. Calcium readily reacts with several anions to form deposits. In addition to calcium carbonate, two additional examples include calcium sulfate (CaSO₄) and calcium phosphate (Ca₃(PO₄)₂). The latter has become problematic in cooling water applications since the shift to phosphate/phosphonate treatment chemistry in the 1980s. Similarly, magnesium can combine with silica and other ions to form tenacious deposits where pH has a large influence on the chemistry.
Hydrogen Sulfide (H₂S): In low concentrations, hydrogen sulfide has a rotten egg smell, and it is often present in well waters. H₂S levels as low as 0.1 mg/L can adversely affect the performance of RO or nanofiltration (NF) systems. If the water is exposed to air or other oxidants, the gas can convert to elemental sulfur or metallic sulfides. A reaction with oxidants commonly results in black or gray deposits, which leads to the formation of a residue that fouls RO membranes.
Iron (Fe) and Manganese (Mn): Fe and Mn can exist in a soluble or particulate state in water. The dissolved species are common in well waters where the absence of air establishes reducing conditions. Staining of toilets and lavatories frequently occurs in homes on well water, as both elements react with oxygen to form dark precipitates. Similarly, in surface waters these elements combine with oxygen to form particulates. Both elements can foul ion exchange resins and RO membranes, and they can catalyze oxidative attacks of RO membranes. A common guideline to protect water systems from iron and manganese fouling is to maintain a concentration below 0.05 mg/L for each. In pretreatment systems with clarifiers and polishing multi-media filters, iron and manganese particulates are often captured. However, for some applications, such as direct well water feed to process equipment, manganese greens and filtration may be necessary to remove the metals.
Orthophosphate (PO₄): Phosphate may be present in surface supplies due to fertilizer runoff from farm fields. High phosphate concentrations are common in POTW effluent, particularly if secondary treatment is the final step in the process. Like natural alkalinity, ortho-phosphate exists in various species, such as H₃PO₄, H₂PO₄-, HPO₄²⁻ and PO₄³⁻, according to the supply pH. In some systems, such as cooling towers, where water “cycles up”, control of calcium phosphate Ca₃(PO₄)₂ deposition is extremely important.
Silica (SiO₂): Silica can exist in soluble, colloidal, or particulate form. Because silica is a primary component in soil and the earth’s crust, particulates in surface waters usually contain high amounts of silica. However, this form is not chemically reactive and can be removed from the water using standard clarification and/or filtration. Dissolved silica, commonly referred to as reactive silica, is the most troublesome silica species. At a mildly acidic pH, it can form hard, tenacious SiO₂ deposits. Conversely, at pH levels 8 and above, silica exhibits a tendency to react with metals, including Ca, Mg, Fe, Mn, and Al, to form a tenacious metal silicate scale. A common guideline for unit operations, including RO and cooling towers, is a reactive silica limit of approximately 120 to 150 mg/L (at ambient temperature) anywhere in the system. Under certain conditions, silica can polymerize to form colloids. These are unreactive at ambient temperatures. Prior to the introduction of RO to the power industry, difficulties arose when events like heavy rain dislodged colloidal silica from the bottom sediments of surface supplies. This lead to colloids entering the makeup stream. Though these unreactive colloids would pass cleanly through the anion exchange resin of the demineralizer, they would then break down into reactive silica inside the boiler.
Sulfate (SO₄): While sulfate can combine with many cations, those of primary concern for makeup systems are calcium, barium, and strontium, each capable of fouling RO membranes. Demineralizer cation resin regenerations are often conducted in stages, with lower sulfuric acid dosages at the beginning of the process to control CaSO₄precipitation. As the calcium is removed, the acid concentration can be increased.
Total dissolved solids (TDS): TDS measures the number of dissolved compounds, inorganic and organic, in a water sample. The typical procedure is to filter the sample for particulates, then dry a measured volume to completeness in an oven at a temperature slightly above the boiling point. TDS approximately correlates to the specific conductivity (S.C.) of water, thus S.C. readings are commonly used for general monitoring and chemistry control of many systems, including RO. Best practice suggests a conductivity-to-TDS conversion factor of 0.65, but this ratio is variable depending upon the ionic species in solution.
Total organic carbon (TOC): TOC is the measurement of organic carbon in aqueous systems. An upper TOC limit of 3 mg/L must be maintained to avoid serious RO and demineralizer fouling. Organic compounds common to raw waters include tannins, lignins, and humic acids, which are large molecules that have significant fouling potential.
Turbidity: A water sample’s clarity, or turbidity, is related to the particles suspended in the sample. Visually, the water may appear hazy or cloudy. Modern nephelometers provide precise measurements with readings reported as nephelometric turbidity units (NTU). Some modern micro- and ultrafiltration systems can produce RO feed with turbidities of less than 0.05 NTU.
Complete and accurate raw water analyses, preferably over a sufficient time period to highlight seasonal variations, are critical in determining the proper pretreatment design to protect downstream high-purity equipment.
Pretreatment Methods
While the primary focus of this section is the pretreatment of surface waters, it will also discuss details on other makeup sources. We will begin with the well-established technology of clarification for suspended solids removal.
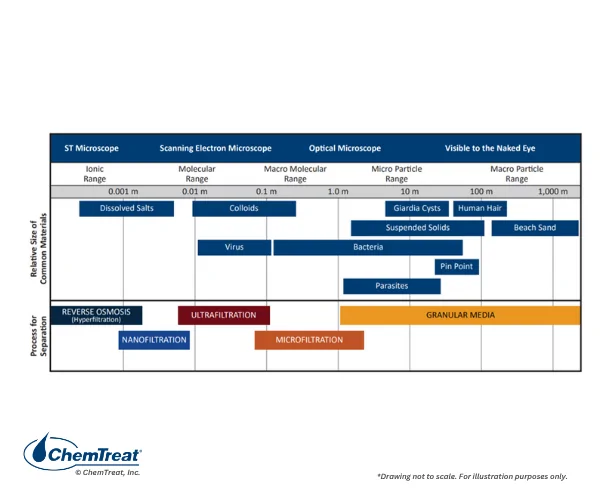
Figure 2.1 illustrates the ranges of dissolved and suspended solids in water, and it highlights filtration techniques for solids removal.
Figure 2.1. Relative Size of Suspended and Dissolved Solids
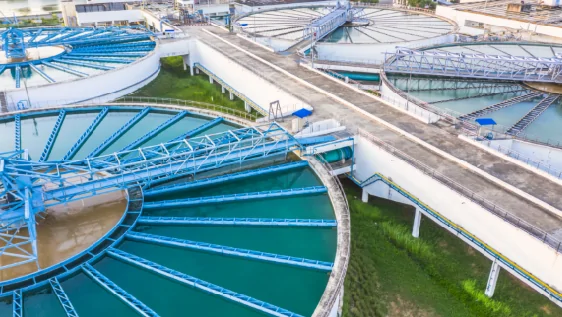
An inlet settling basin, a primary feature of some makeup water pretreatment systems, reduces the linear flow rate of the influent and allows larger materials to precipitate using gravity. However, many small particles remain after this process. Typically, these particulates are lightweight, negatively charged, and mutually repellant. Clarifiers, which utilize both physical and chemical methods, are commonly used to remove these solids. Older-style clarifiers relied on a large volume to enhance settling. An example is shown in Figure 2.2.
Figure 2.2. Large circular clarifiers.
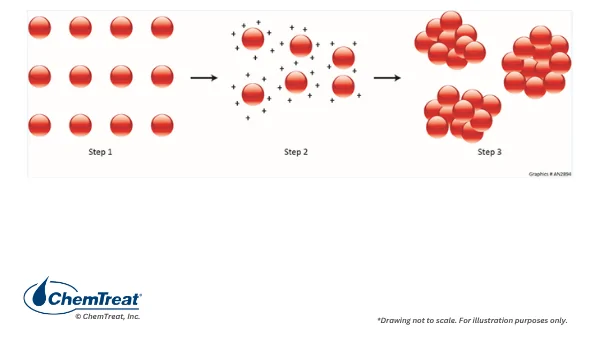
Clarifiers of this style typically have rise rates, which is the ratio of product flow to the surface area at the top of the clarifier, of 0.5 to 1.5 gpm/ft2. Low rise rates are necessary to allow chemical additives time to react with the suspended solids. The normal process, as outlined in Figure 2.3, is coagulant (positively charged compounds) addition to reduce the negative charge on the particles, followed by flocculant treatment to coalesce the coagulated particles into larger flocs that settle.
Common design parameters for basic clarifiers are:
Flow: Defined as gpm, gallons per day (gpd), or cubic feet per minute (ft3/minute)
Retention time calculation: Clarifier volume divided by flow. Units are usually expressed in minutes or hours. Typical range is one to four hours.
Horizontal clarifier flow calculation: Inlet flow (ft3) divided by clarifier cross-sectional area (ft2). Units calculate to feet/minute.
Rise rate (or hydraulic loading): Inlet flow in gpm divided by surface area of clarifier in ft2. In original clarifier designs, the typical rise rate ranged from 0.5 to 1.5 gpm/ft2. 25 gpm/ft2 or greater is possible in some modern units, as is discussed shortly.
Clarifier weir overflow rate: Inlet flow in gpd/lineal feet of weir, usually 10,000 to 20,000 gpd/lineal foot.
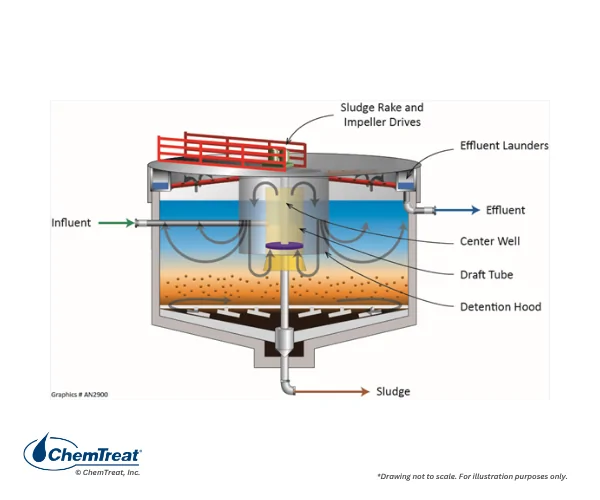
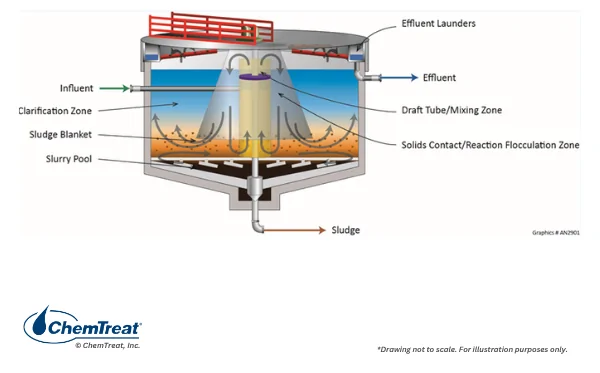
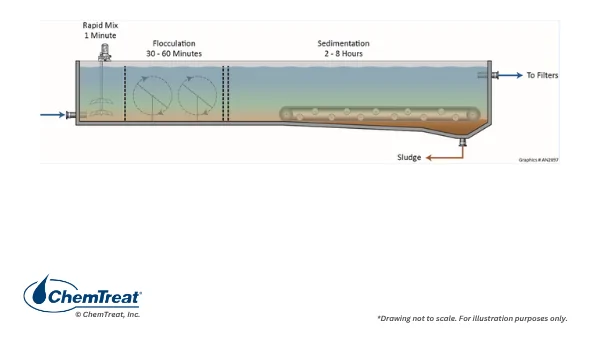
Conventional clarifiers include a rapid mix zone, slow mix flocculation zone, and large settling zone. Two common types are shown below, both of which provide long hydraulic residence times and require a large footprint.
Rapid mixing and coagulation occur in the inlet cylinder of the clarifier. Flocculation takes place below the much larger hood, where linear flow rates are lower. Settling takes place in the outer regions of the vessel where freshly flocculated particles are captured by the established sludge blanket. Bottom rakes remove the accumulated sludge for disposal or further processing in a filter press. The bottom rakes may operate continuously or on a timed program. Sludge blowdown may be automated or manual, typically on a periodic basis. For manual blowdown, the operator must remember to halt the blowdown at the proper time. There are cases where operators have bled down the entire sludge blanket, which has led to the carryover of suspended solids from the clarifier. Once this occurs, considerable effort is necessary to restore the sludge blanket.
Figure 2.7 illustrates a rectangular clarifier, with the rapid mix, flocculation, and settling zones clearly outlined. An even more modern version of a rectangular clarifier appears shortly.
Figure 2.7. Rectangular Clarifier
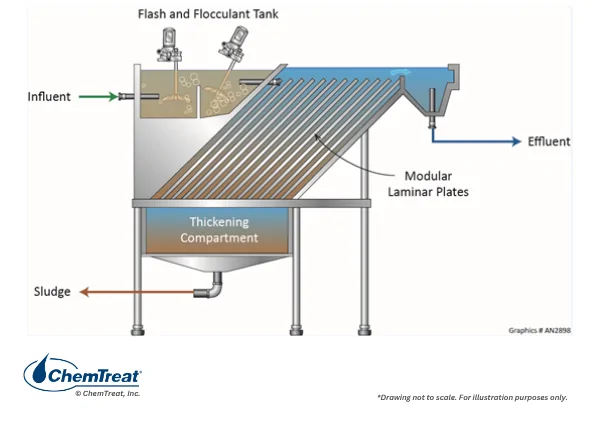
The low rise rate of early clarifiers, and accompanying large footprint, drove engineers to produce units with increased rise rates, better efficiency, and smaller sizes. One of the first developments in this regard was the lamella clarifier.
Figure 2.8. Lamella Clarifier
Lamella clarifiers have inclined plates that enhance the interaction of particles flowing upwards, with heavier particles settling downward. Hydraulic rise rates of 6 gpm/ft2 are possible, though a unit may not achieve such rates if the inlet water has excessive suspended solids, which can build up between the plates. Solids may then overflow into the effluent, requiring a load reduction.
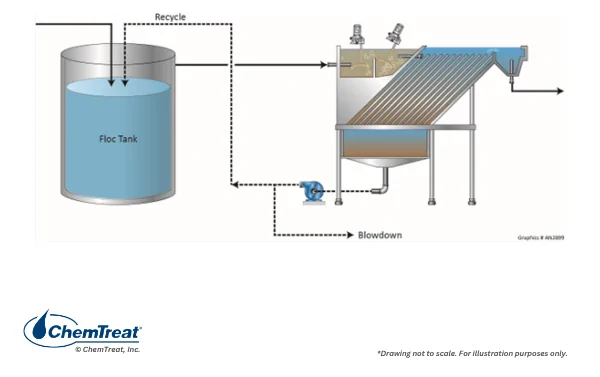
One lamella design modification includes sludge recycle to improve efficiency, as shown in Figure 2.9. The recycle stream seeds the process. This modification offers operational flexibility for variations in inlet water quality.
Figure 2.9. Sludge Recirculation in a Lamella Clarifier
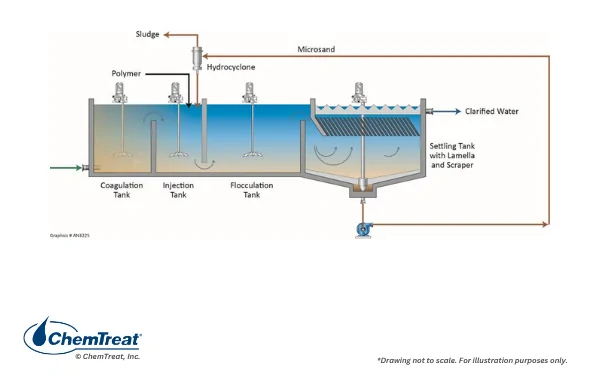
The ballasted design is a modern advancement in clarifier technology which, in part, is based on the recycle concept. A well-known configuration, Acti-Flo®, is shown below.
Figure 2.10. Process flow diagram of Acti-Flo®.
The unit has rapid and slow mix zones in line with normal coagulation and flocculation methods, and its’ prominent feature is the injection and recirculation of micro-sand. The sand particles gather the flocs, but settle out rapidly in the main clarifier with its lamella plates as they are significantly heavier. With ballasted systems, rise rates of 25 gpm/ft2 or greater are possible. As the figure shows, a hydrocyclone is an integral part of the process. The circular motion imparted by the hydrocyclone causes the heavier micro-sand particles to exit through the underflow and back into the process, while the liberated floc particles exit the overflow for final disposal. This process recovers most of the micro-sand, greatly reducing fresh additions.
While other similar systems have evolved, they feature key differences. A prime example is the Co-Mag® process with a ballast material of the iron oxide, magnetite (Fe₃O₄). This process has emerged as an effective treatment for industrial wastewaters containing heavy metals, some of which co-precipitate well with magnetite and are directly removed from solution.
Clarifier Operating Variables and Monitoring/Troubleshooting Techniques
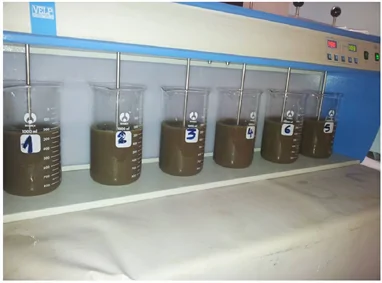
The initial step in evaluating the proper chemistry program for a new clarifier is jar testing, often performed on site where raw makeup samples are accessible.
Figure 2.11. A common mechanical stirring set up for jar testing. Typically, the mixers are set at a fast speed for coagulant addition and then are slowed for flocculant addition.
With jar testing, both coagulants and flocculants must be tested in combination, and the testing can take time to optimize the chemistry and dosage rates.
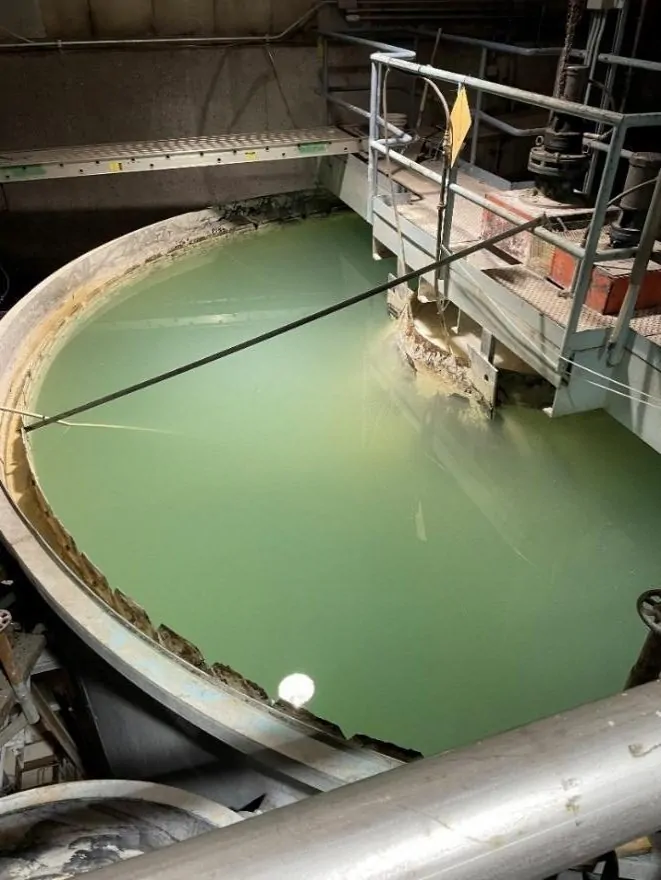
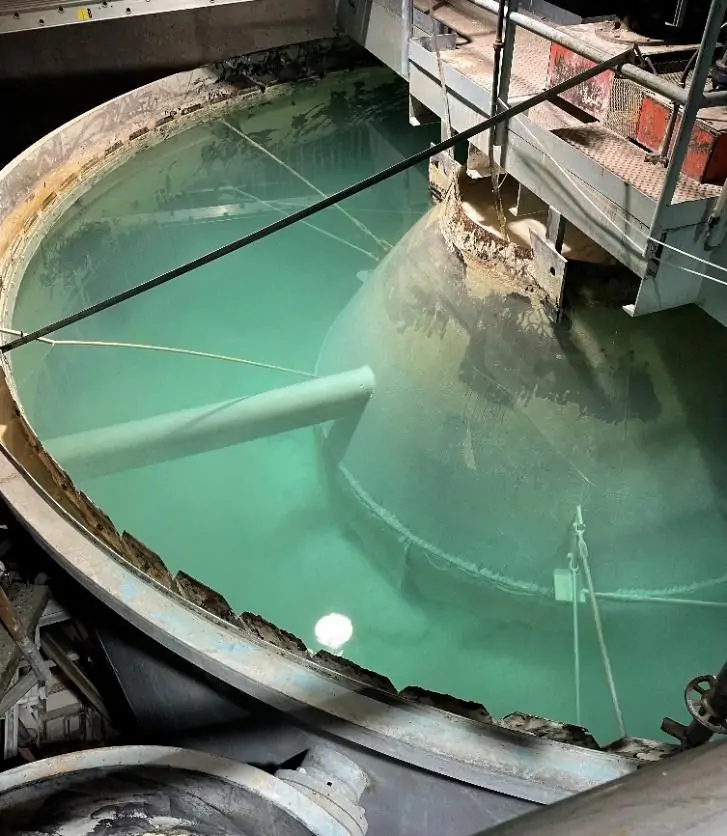
As Figures 2.13a and 2.13b illustrate, the results from a well-conducted jar test assisted in transforming the historically troubled performance of a lime-softening clarifier into a more reliable operation.
Figure 2.13a. Clarifier with poor coagulant/flocculant selection
Figure 2.13b. The same clarifier with adjusted coagulant and flocculant chemistry initially calculated from jar testing and optimized in the field.
Jar tests are not uniform and are unique to each site. For best results, testing should be performed by an experienced professional.
Coagulant and flocculant feed points should remain consistent with the guidelines outlined earlier in this chapter. In addition to coagulant/flocculant treatment, an oxidizing biocide feed (often bleach) is common for clarifiers well upstream to provide maximum contact time.
During new system startup, and periodically for existing systems, testing is necessary to ensure the chemicals are being fed at the correct dosages. Properly designed chemical feed systems include a graduated cylinder with a “tee” connection to the pump suction line to measure chemical feed rates. For normal operation, many systems utilize electronic communications that automatically adjust chemical feed rates based on inlet water flow readings. Data may be displayed remotely at the chemical feed system and in the plant control room.
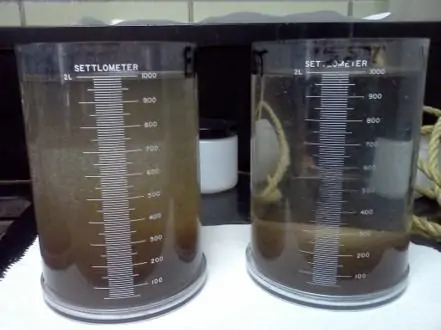
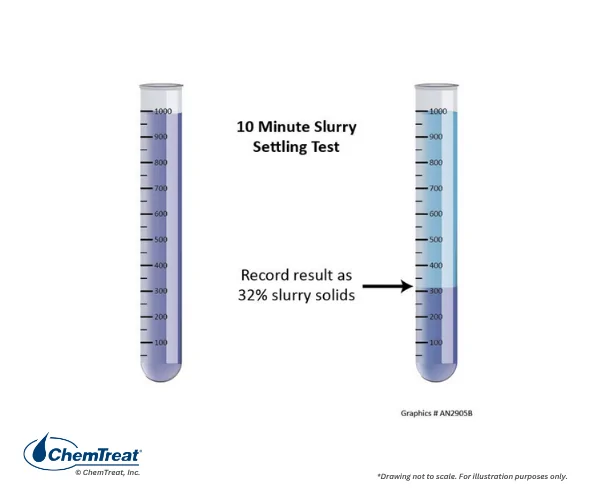
Clarifier slurry solids concentrations indicate the inventory of solids available for reaction. Most clarifiers include sample taps installed at various heights for the collection of solids.
A 1,000 mL sample collected in a graduated cylinder is allowed to settle for ten (10) minutes. The test, also referred to as the settled volume over initial volume (V/Vo), should be in the target range of 20 to 40% slurry solids.
Figure 2.14 – Slurry Solids V/Vo Test
These tests can assist in blowdown control from the clarifiers and provide visual observations of the supernatant quality, such as the clear water above the settled solids.
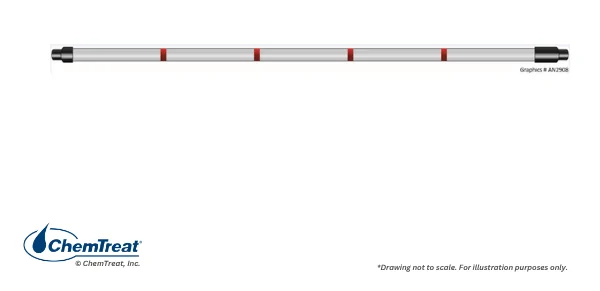
In a properly operating clarifier, the sludge forms a distinct blanket that can be observed from above the clarifier, as in Figure 2.13b. The clarifier supplier should provide a recommended sludge blanket range. Level measurement is important to ensure that a sufficient blanket is present to collect new flocs, and the data is also important for controlling blowdown. Several methods are available to measure sludge depth, including lowering a rope knotted at one-foot intervals with a plate attached to the end. The plate will disappear when exposed to the top of the sludge bed, allowing sludge depth to be accurately determined. Additionally, another method utilizes a Sludge Judge® sampler, which physically profiles the water in the clarifier. The sampler features markings at one-foot increments to measure the sludge depth and provide a water quality profile. Sonar systems are also available for sludge depth measurement.
Figure 2.15. Illustration of a Sludge Judge.
Careful sludge depth control by blowdown is a priority, as excess sludge accumulation can result in a particulate carryover into the effluent or the plugging of sludge extraction piping. Excess blowdown can also degrade clarifier performance by removing the material that captures newly-formed flocs. This situation may require the re-seeding of the clarifier with artificial agents. One common seed material is kitty litter.
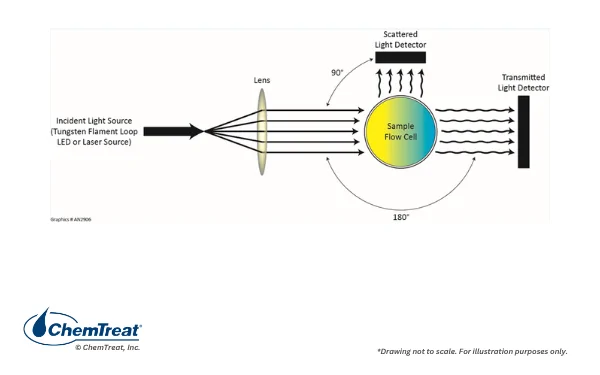
Effluent turbidity is an important measurement for clarifier performance. Electronic turbidity instruments are well established to measure the amount of light scattered by material in the water, as shown in Figure 2.16.
Figure 2.16. Graphical illustration of turbidity measurement.
Silt, finely divided organic and inorganic matter, algae, microscopic organisms, and soluble, colored organic compounds are examples of materials that influence turbidity. Turbidity monitoring of the clarifier inlet and outlet provides valuable comparative data.
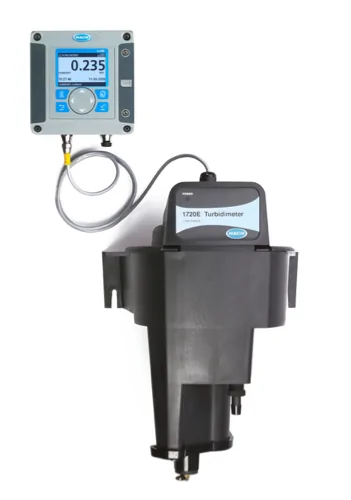
Figure 2.17. An online turbidimeter model. Readings are in nephelometric turbidity units, as discussed earlier in this chapter. Photo courtesy of Hach.
The continuous monitor can be set to alarm when turbidity conditions are excessive. High turbidity in the inlet may require an adjustment of chemical feed rates and, in severe cases, additional jar testing and chemistry adjustments.
Multiple factors can upset clarifier performance, such as changes in water chemistry, temperature, or a sudden flow surge that increases the rise rate and causes the blanket to expand. Suspended solids fluctuations are common in clarifiers that treat surface water supplies, especially during heavy precipitation events. Additionally, lake turnover in the spring and autumn can increase the suspended solids concentration. Conversely, the reverse effect may be troublesome if a decrease in suspended solids loading causes the sludge blanket to shrink.
Efficiently operated clarifiers usually produce water with turbidity of 2 NTU or lower and suspended solids concentrations less than 5 ppm. These values can be lowered with downstream filtration, which is common and will be discussed later in this chapter.
In some cases, high concentrations of hardness, alkalinity, and silica may require additional chemical treatment to precipitate a portion of these elements and compounds to lower the scale-forming potential of the makeup. The next section examines this technology.
Industrial Complex Saves Over $7M with ChemTreat Treatment Program and Intelligent Water Management
The objective of precipitation softening is to form insoluble hardness solids, specifically calcium carbonate (CaCO₃) and magnesium hydroxide (Mg(OH)₂), which are removed from the clarifier along with suspended solids. Additionally, some silica may co-precipitate with magnesium hydroxide.
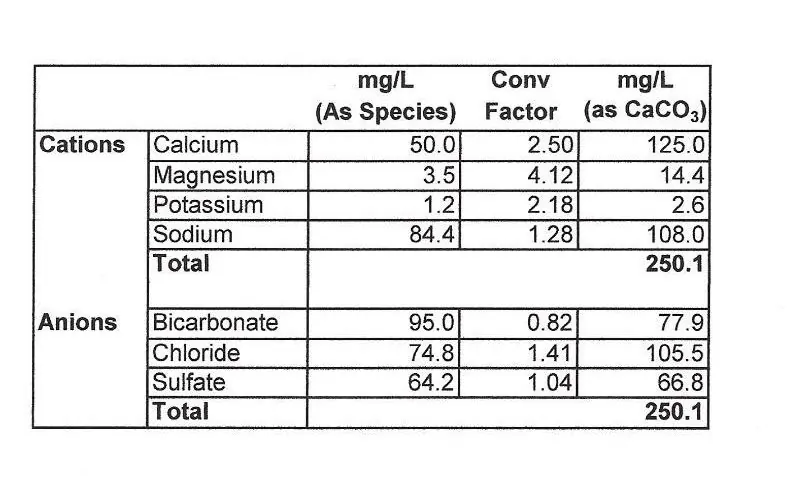
In conjunction with lime, supplementary treatment with sodium carbonate (Na₂CO₃ or soda ash) may be required. To provide context for understanding the chemistry of lime softening reactions, consider the following raw makeup water sample, which details the major cations and anions and their calcium carbonate equivalents.
Figure 2.18. A raw water example to illustrate major cation-anion balance.
Natural waters, where cations and anions are balanced, are electrically neutral. The equivalents of CaCO₃ serve as an accounting tool that indicates the overall cation-anion balance, which includes monovalent species such as sodium (Na+) and chloride (Cl–) ions, and the divalent ions Ca²⁺, Mg²⁺, and SO₄²⁻.
This accounting tool allows for the following bar chart, which shows how ions associate in water.
Figure 2.19. Association of ions in water. Values taken from Figure 2.20.
The hardness associated with bicarbonate alkalinity or related species is known as “carbonate” or “temporary” hardness. Hardness associated with chloride or sulfate is known as permanent hardness and requires the addition of soda ash.
Of note, in equations 2.9 and 2.10, no hardness is reduced. Magnesium chloride and sulfate are replaced by calcium chloride and calcium sulfate.
Depending on the final hardness requirements, calcium noncarbonate hardness present in the raw water and created from equations 2.9 and 2.10 can be reduced with soda ash.
CaCl₂ + Na₂CO₃ → CaCO₃↓ + 2NaCl Eq. 2-11
CaSO₄ + Na₂CO₃ → CaCO₃↓ + Na₂SO₄ Eq. 2-12
The necessity for soda ash feed in conjunction with lime is determined by the raw water composition and the hardness requirements of the treated water.
A Guide for Troubleshooting and Treating Demineralizers
Coagulants/Flocculants and Sludge Bed Conditioners
Softening clarifiers produce significant sludge, as demonstrated by the precipitation reactions above. However, if the raw water has an appreciable concentration of suspended solids, softening alone may not remove enough solids. This can lead to treated water with undesirable turbidity. In this case, a cationic coagulant may be necessary to condition the clarifier influent. High molecular weight flocculants can aid settling and ensure a consistently clear effluent.
If solids carryover in the clarifier effluent becomes problematic, a simplistic method like the acidified hardness test may reveal the source. To perform an acidified hardness test, acid is added to one portion of a split sample, where the acid dissolves softening reaction products. Subsequent hardness measurements on both samples will reveal the hardness difference, should one exist. If the hardness of the acidified sample is appreciably higher, the suspicion falls on the softening chemistry. If not, coagulation/flocculation chemistry should be investigated.
Lime softening clarifiers rely on a sludge bed or solids contact design to increase the size of newly-formed precipitates, much like clarifiers designed for suspended solids removal. Lime softening precipitates, however, may have different properties than those of basic suspended solids clarifiers, including greater density and larger volume. Establishing a stable bed may require a sludge conditioner. A prime example is if the calcium-to-magnesium ratio is large. Magnesium hydroxide precipitate acts as a natural bed conditioning agent that ensures the sludge is well suspended. If insufficient magnesium hydroxide is present, the sludge can become very heavy and difficult to circulate. Supplemental aluminum and iron coagulant feed can generate a lighter hydroxide floc that improves the sludge’s properties.
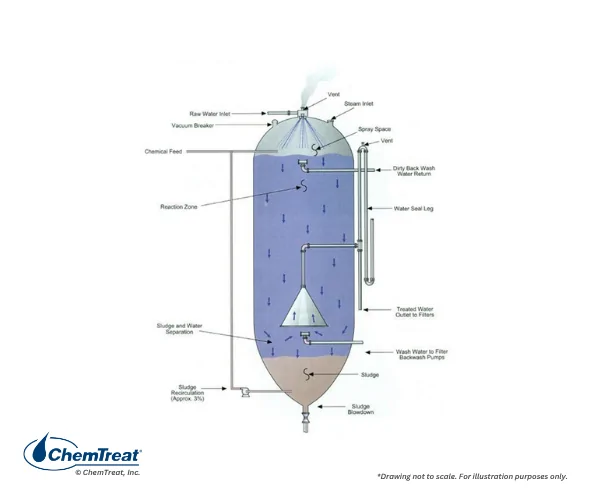
Hot Lime Softening
Hot lime softening was once a common method for primary pretreatment of industrial boiler feedwater, but modern technologies, such as RO, have replaced hot softening to a significant degree.
Hot softening utilizes high temperatures to reduce hardness to low levels by injecting steam to heat the water to approximately 235°F, equivalent to 10 psig pressure. A vent on top of the unit is required to maintain the proper temperature, pressure, and to allow air released from the water to escape. Hot softeners are often selected to preheat the makeup and provide deaeration for low-pressure industrial boilers. The units can reduce hardness concentrations to well below what is achievable by cold lime softeners.
Hot process softeners are designed as upflow sludge blankets or downflow units. In the upflow design, chemicals and steam are fed to the top of the unit into an internal funnel. Sludge recirculation is common.
Figure 2.22. Basic design of an upflow, sludge blanket hot softener.
Softening reactions begin in the downcomer from the funnel. The mixture is directed to the bottom of the unit and into a pre-established sludge blanket where large precipitates form on previously precipitated solids. Typically, hardness can be lowered to less than 5 mg/L. The treated water flows upward and out of the unit.
A downflow softener relies heavily on recirculated sludge.
Figure 2.23. Basic design of a downflow hot process softener.
As in the upflow design, chemicals, steam, and recirculated sludge are introduced at the top of the unit. The water flows downward through the vessel while precipitates collect at the bottom and are removed or recirculated as needed. Effluent flows upwards through the hood and then into the process. Hardness concentrations canbe lowered to less than 15 mg/L in this design.
Filtration
Clarification removes many solids that could cause scaling and fouling in industrial plant cooling systems, heat exchangers, boilers, high-purity makeup treatment systems, and other equipment. Normally, a form of filtration is also utilized to further remove solids. In some cases where the raw makeup is clean freshwater, such as from a lake or reservoir, filtration (micro- and ultrafiltration as described in a later section) may be sufficient for suspended solids removal. However, alternative supplies offer greater challenges to pretreatment processes, including filtration. In addition to particulate removal, other forms of filtration may also be used to remove oxidants, dissolved iron and manganese, or additional impurities.
Media Filters
Media filtersrely on stratified beds of material to remove particulates of variable sizes. These filters are gravity or pressure type. Gravity filters rely on gravity to force water through the media with a typical flow rate of 2–4 gpm/ft2 of surface area. Because of their smaller size, pressure filters are common and can be delivered off the shelf. The flow rate for pressure filters is typically 4–6 gpm/ft2.
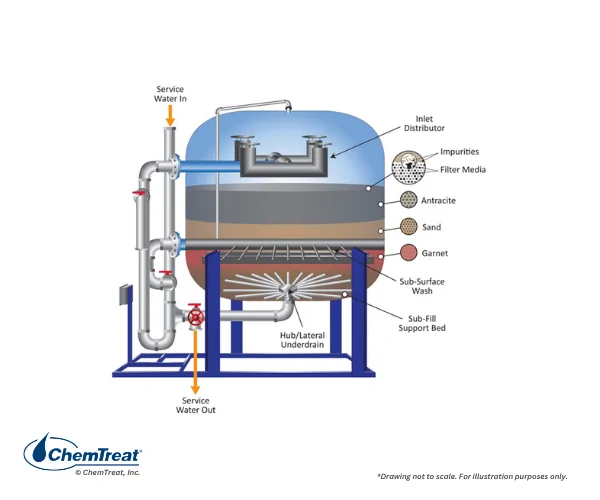
A common multimedia filter design is shown in Figure 2.24.
Figure 2.24. A common multimedia filter schematic.
The various media function together to remove particles of varying size, as follows:
Anthracite: Anthracite is irregularly shaped and has fractured grains, providing good filtration of larger suspended particles. A typical grain diameter ranges from 0.95 to 1.05 mm. Anthracite is not as durable as sand or garnet and will fracture into smaller grains, which gradually escape during backwashes. This makes periodic replenishment necessary.
Sand: Sand grains are usually approximately 0.4–0.55 mm in size, with an average of 0.5 mm. Most suspended solids are trapped within the top four to six inches of the sand layer. The buildup of this “cake” or mat layer, commonly called by its German name “schmutzdecke,” gradually increases the pressure drop across the bed. Without regular backwashing, the particulates can irreversibly clog the bed and potentially penetrate through it.
Garnet: Garnet is the heaviest and smallest-sized media, with grain diameters ranging from 0.25–0.3 mm. It acts as a polishing layer.
The combination of anthracite, sand, and garnet progressively filter large to small particulates. A common multimedia filter, for example, may contain:
18 inches of anthracite
12 inches of sand
6 inches of garnet
The void space of the different media can also influence the loading on the various beds.
Anthracite, ~50%
Sand, ~39%
Garnet, ~47%
Consider the following example of a filter with a flow rate of 4 gpm/ft2. The linear velocity through anthracite can be determined with the following calculations that incorporate the void space data shown above.
4 gpm/ft2 ÷ 7.48 gallons/ft3 = 0.53 ft/min
0.53 ft/min ÷ 0.5 = 1.06 ft/min
As the flow moves into the sand layer, the calculation becomes:
0.53 ft/minute ÷ 0.39 = 1.36 ft/minute
A similar calculation can be performed for garnet.
As the water flows into the filter, the particles experience increased impact with the anthracite due to the increase in velocity. The same effect occurs in sand. If the incoming particles are delicate, which is common in clarifier effluent, there is a high likelihood they will fracture into finer material. This effect illustrates the importance of the garnet layer for polishing, which can remove particulates down to 10 microns.
While media filters are considered low technology, it is still important to monitor their operation and maintain consistent performance. A malfunctioning filter can severely foul downstream equipment, most notably RO units. A filter aid (low dose of cationic coagulant) may be effective in enhancing suspended solids removal. Caution is needed, however, as cationic coagulants/flocculants can severely foul RO membranes, which typically have a negative charge.
Effluent turbidity and pressure drops across the media are important parameters for filter performance monitoring. The following list outlines the common backwash initiators:
ΔP, typically 10 psi above baseline
Turbidity
Throughput
Time
Continuous monitoring of pressure differentials typically provides the most reliable results for initiating backwash.
The backwash stream flows counter-currently to normal process flow. Accordingly, the backwash rate must be calculated based on the lightest media in the unit, anthracite, and must consider temperature. Water density significantly increases with decreasing temperature. If the backwash rate is not adjusted for water temperature or is above operating guidelines at any temperature, anthracite will be washed away.
If the backwash valve opens quickly, the water surge can induce media bursts that expel material from the unit. A typical solution involves a step-wise approach to water admission, where valves are held partially open for several minutes before being opened fully.
While backwashing is key to steady filter performance, the media can still accumulate debris that require periodic cleanings. Biofouling is possible, though upstream feed of an oxidizing biocide will aid in controlling microbiological growth. To determine if the fouling has become problematic, aerobic bacteria dip slide tests should be conducted simultaneously on the inlet and outlet streams. If bacteria concentrations are greater at the outlet, this is a sign that bacterial colonies are present in the media. Off-line cleaning with a combination of bleach and surfactant can be effective. A common procedure is to inject the cleaning chemicals into the unit through the backwash system, letting the solution soak the media for an extended period.
Particulate matter entrained in water is known as suspended solids; the analytical reporting term is total suspended solids (TSS). Suspended solids control is important to minimize sludge buildups at the plant discharge, and to prevent entrained toxic materials from being discharged with the solids. TSS may be a reporting requirement and it is a method to evaluate the performance of chemical coagulation/flocculation systems, filtration systems, and activated sludge treatment systems.
Oil and grease refer to the fats, oils, waxes, and other related materials found in wastewater. Oil and grease (O&G) analysis identifies these foulants that may be present in the wastewater discharge. Oil and grease reduction is often required upstream of biological wastewater treatment systems, as excessive O&G can foul equipment and lower the oxygen uptake efficiency of activated sludge microorganisms.
Later sections in this chapter discuss the techniques of oil skimming and dissolved air flotation (DAF) for O&G removal.
Many wastewater streams contain either acidic or alkaline (basic) compounds. These can seriously harm aquatic organisms. A common NPDES discharge pH range is 6.0–9.0. (Some local or regional guidelines may have a slightly different range.)
Chapter 7 provided details on both oxidizing and non-oxidizing biocide feed for control of cooling system microbiological fouling. Reduction of residual biocide concentrations at the plant discharge may be necessary for some wastewater systems.
At refineries, petrochemical plants, and related facilities, organic chemicals often appear in wastewater streams. These compounds may range from small molecules to large chains, and some may be directly toxic to aquatic creatures, animals, and humans. Additionally, organics and O&G (and nutrients such as nitrogen and phosphorus) directly influence the biochemical oxygen demand (BOD) and the chemical oxygen demand (COD) of receiving waters.
The BOD5 test measures organic pollutant loadings in wastewaters. Per Reference 2, BOD “is commonly measured by determining the quantity of oxygen utilized by suitable aquatic organisms during a five-day period while decomposing organic pollutants.” BOD testing is generally required for industrial and municipal wastewater effluent. Many industrial plants do not have the trained personnel or equipment to perform BOD5 analyses and must submit samples to a certified laboratory.
The COD test employs a strong chemical oxidant, potassium dichromate, to oxidize organic matter of all types. Typically, COD analyses produce a higher reading than BOD results because more compounds are chemically oxidized than are biologically oxidized. COD analyses can be performed in two to three hours and are an important parameter for monitoring wastewater treatment performance. Companies such as Hach, CHEMetrics, and Cole Parmer offer analytical equipment to conduct on-site COD sample analyses.
Nitrogen species (primarily ammonia and nitrite/nitrate) and phosphorus (as phosphates) provide primary nutrients to microorganisms and create oxygen demand on the receiving stream if directly discharged to receiving bodies of water. Toxic algae blooms have become a major problem in many areas of the country and are heavily correlated to nutrient discharges to receiving waters. Nonpoint sources (farm runoff, etc.) provide a significant portion of nutrients ultimately discharged to receiving waters, although it is quite difficult to measure and manage. Point sources (industrial facilities, publicly owned treatment works, etc.) are typically easier to monitor for nitrogen and phosphorus, and thus, are more easily regulated.
Conversely, ammonia and phosphorus are necessary nutrients for activated sludge wastewater treatment, and direct feed of these nutrients may be necessary to maintain the optimal BOD:N:P ratio and ensure reliable operation.
Simple analytical tests are available for measurement of these compounds.
Heavy metal discharge has come under increasing scrutiny from the EPA, publicly-owned treatment works (POTWs), and state regulatory agencies over the last several decades due to the material-to-extreme toxicity of some elements; mercury being the most well-known. Discharge limits for many metals are in a low micrograms per liter (µg/L, equivalent to parts-per-billion) range, or even nanograms per liter (ng/L, equivalent to parts-per-trillion) for mercury.
Industries most responsible for metals discharge include:
Treatment of POTW Wastewater as Industrial Plant Makeup
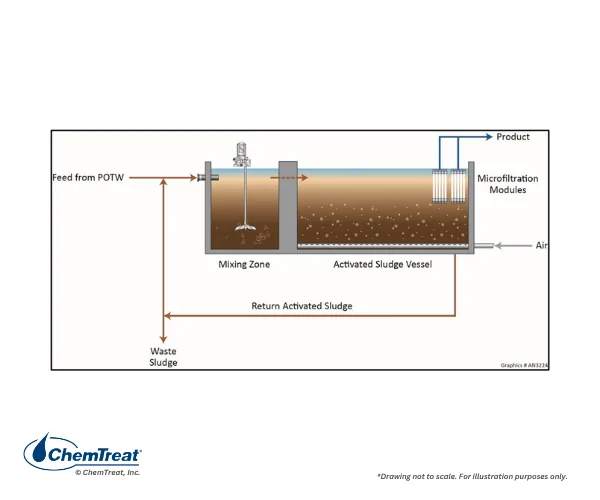
Increasingly, by mandate or choice, industrial facilities are accepting POTW effluent as makeup. As this water has often only received secondary treatment at the wastewater plant, it still contains significant concentrations of ammonia and nitrite/nitrate, phosphate, organics, suspended solids, and microbes. These constituents can initiate and exacerbate severe microbiological fouling in cooling systems and other water networks. Some of the compounds, most notably the nitrogen species and many of the organics, are not captured by conventional clarification/filtration. Microbiological treatment methods have emerged for plants dealing with these issues, including membrane bioreactors (MBR) and moving-bed bioreactors (MBBR). A basic schematic of an MBR is included below.
Figure 2.25. Basic MBR design
The fundamental MBR process involves recycling activated sludge, so that beneficial microorganisms consume the food and nutrients introduced to the main vessel from the mixing zone. A recycle stream helps to bring active, well-established organisms to the inlet of the mixing zone. One significant difference between MBR and conventional activated sludge is the use of microfilter membranes in place of a traditional clarifier for solid-liquid separation in the effluent. The microfiltration process produces a clear stream, essentially free of suspended solids. Though ammonia in the stream is converted to nitrite/nitrate, one limitation of this basic MBR process is that the nitrogen remains in the stream. Thus, nitrogen can still serve as a nutrient in the plant cooling water system. If necessary, this can be mitigated by expanding the MBR system to include anoxic or anaerobic reaction chambers containing microorganisms that convert nitrite/nitrate to elemental nitrogen.
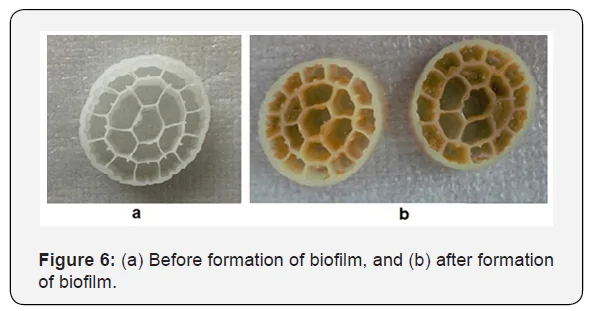
MBBR employs an agitated vessel with mobile plastic media that circulate within the compartment. These media provide sites for the microbes to settle and develop healthy colonies. MBBR resembles a modern version of the old trickling bed technology for wastewater treatment. Unlike MBR, the micro- or ultrafilters that polish MBBR effluent must be located externally to the reaction vessel.
Figure 2.26a-b. Common media for MBBR, before biofilm (2.26a) and after (2.26b) biofilm attachment.
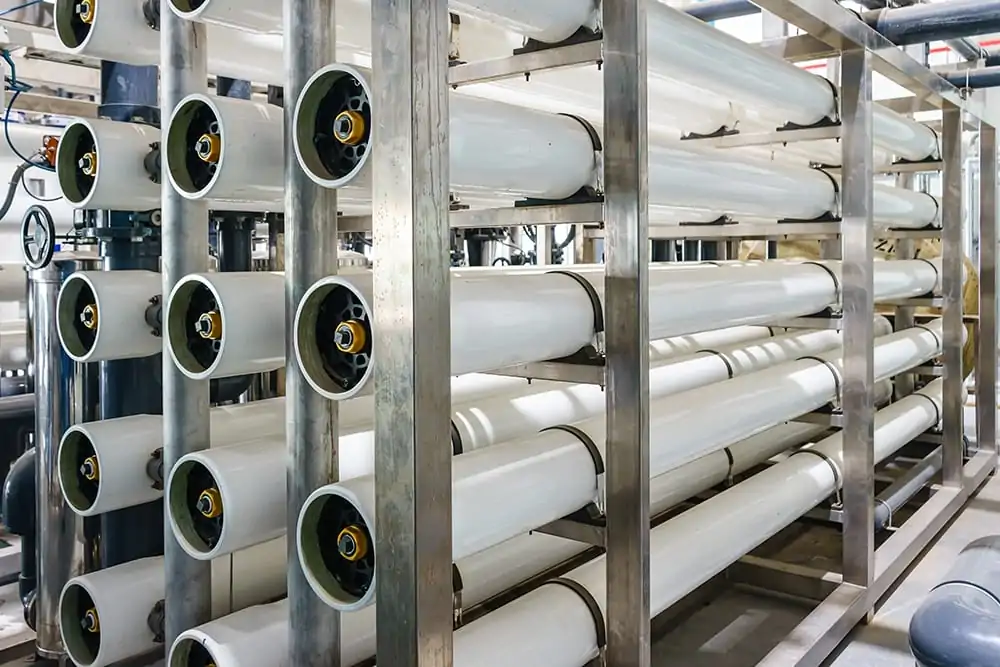
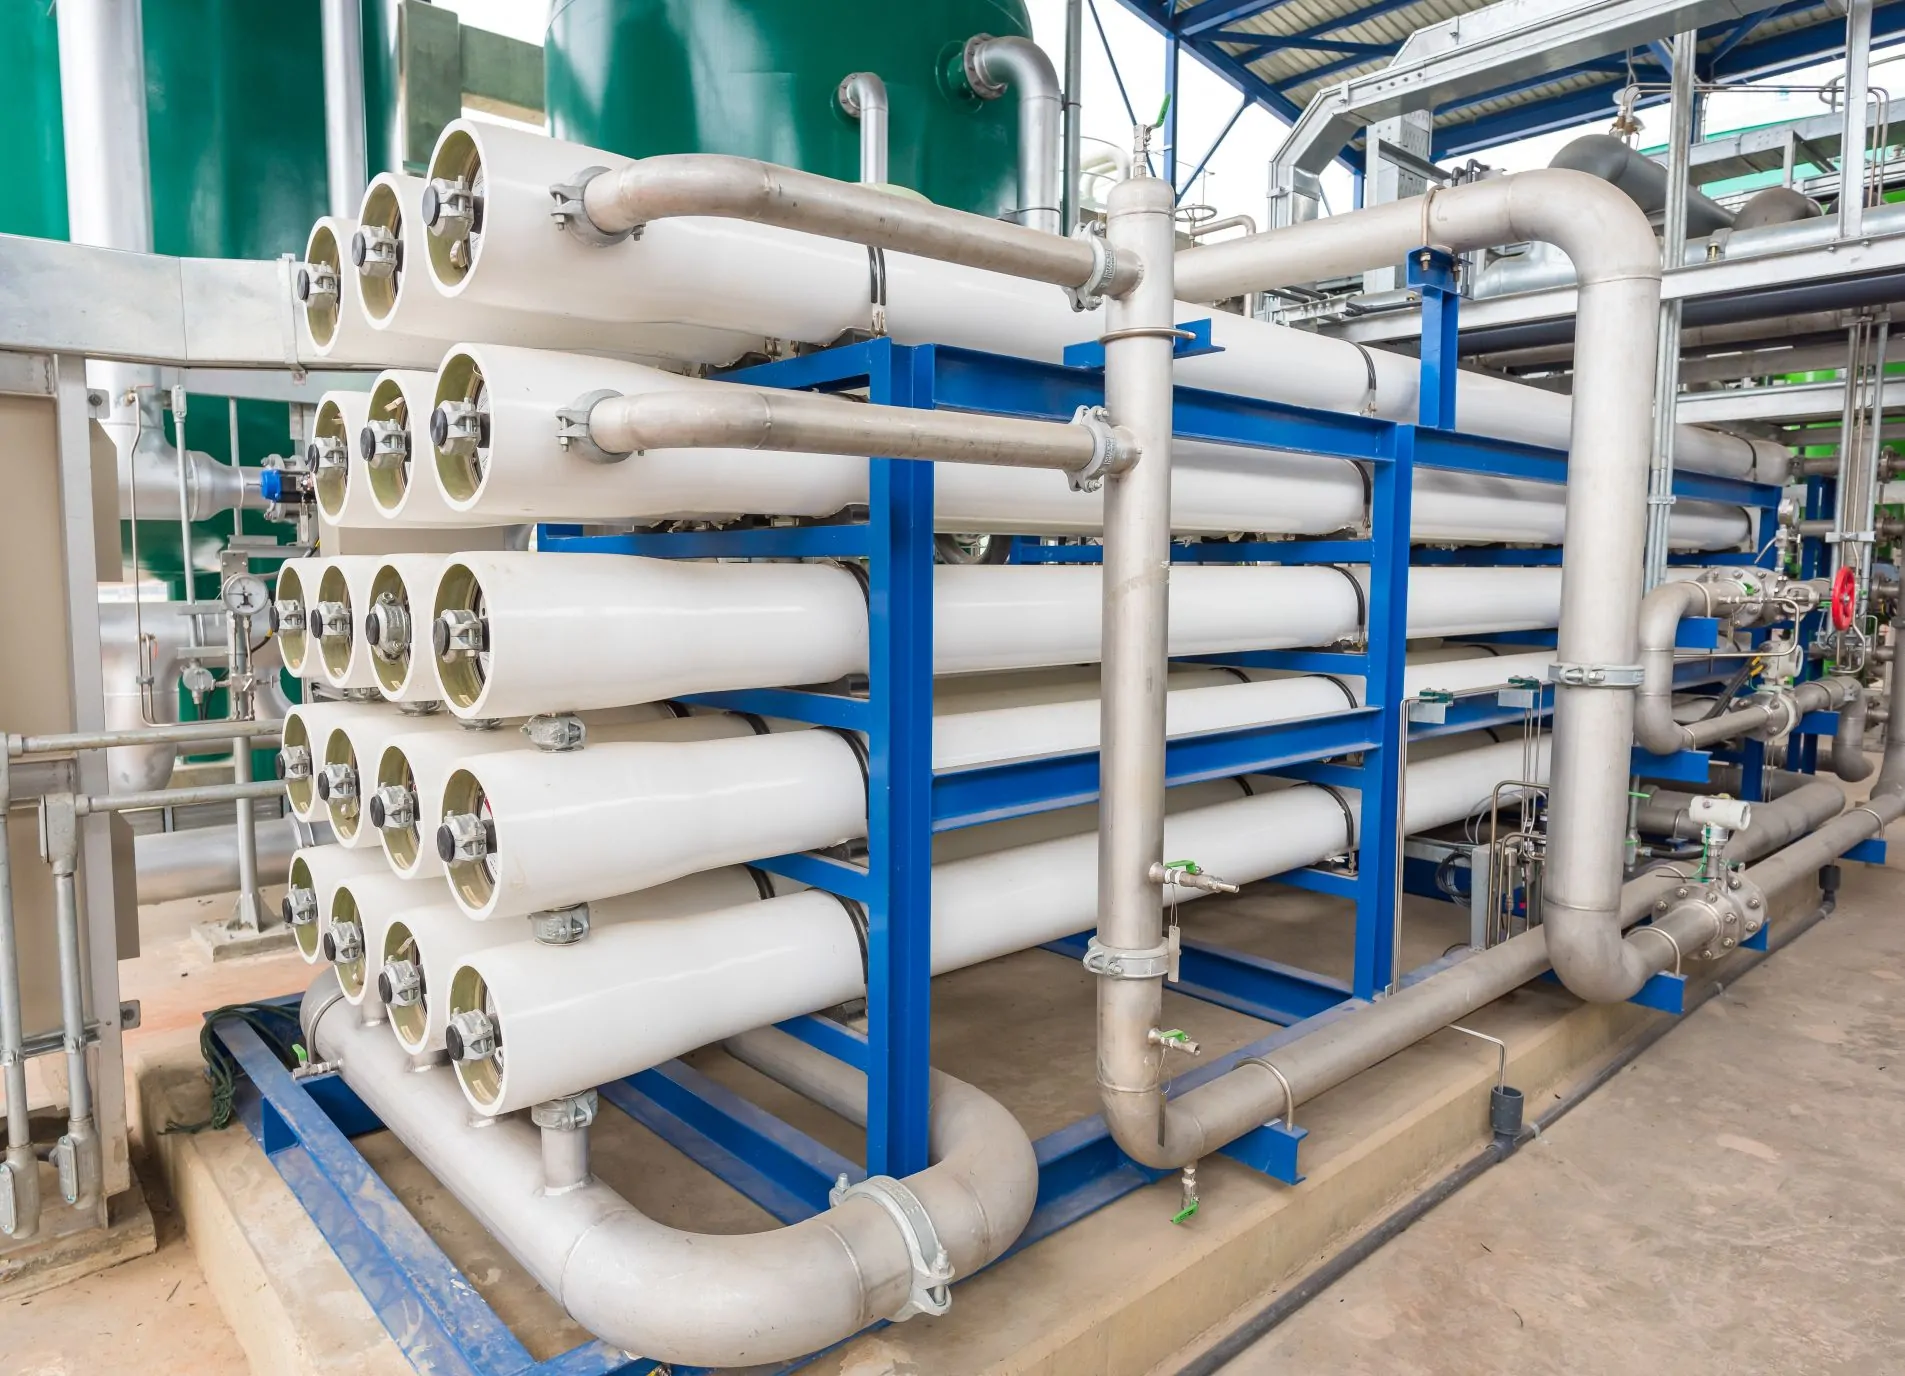
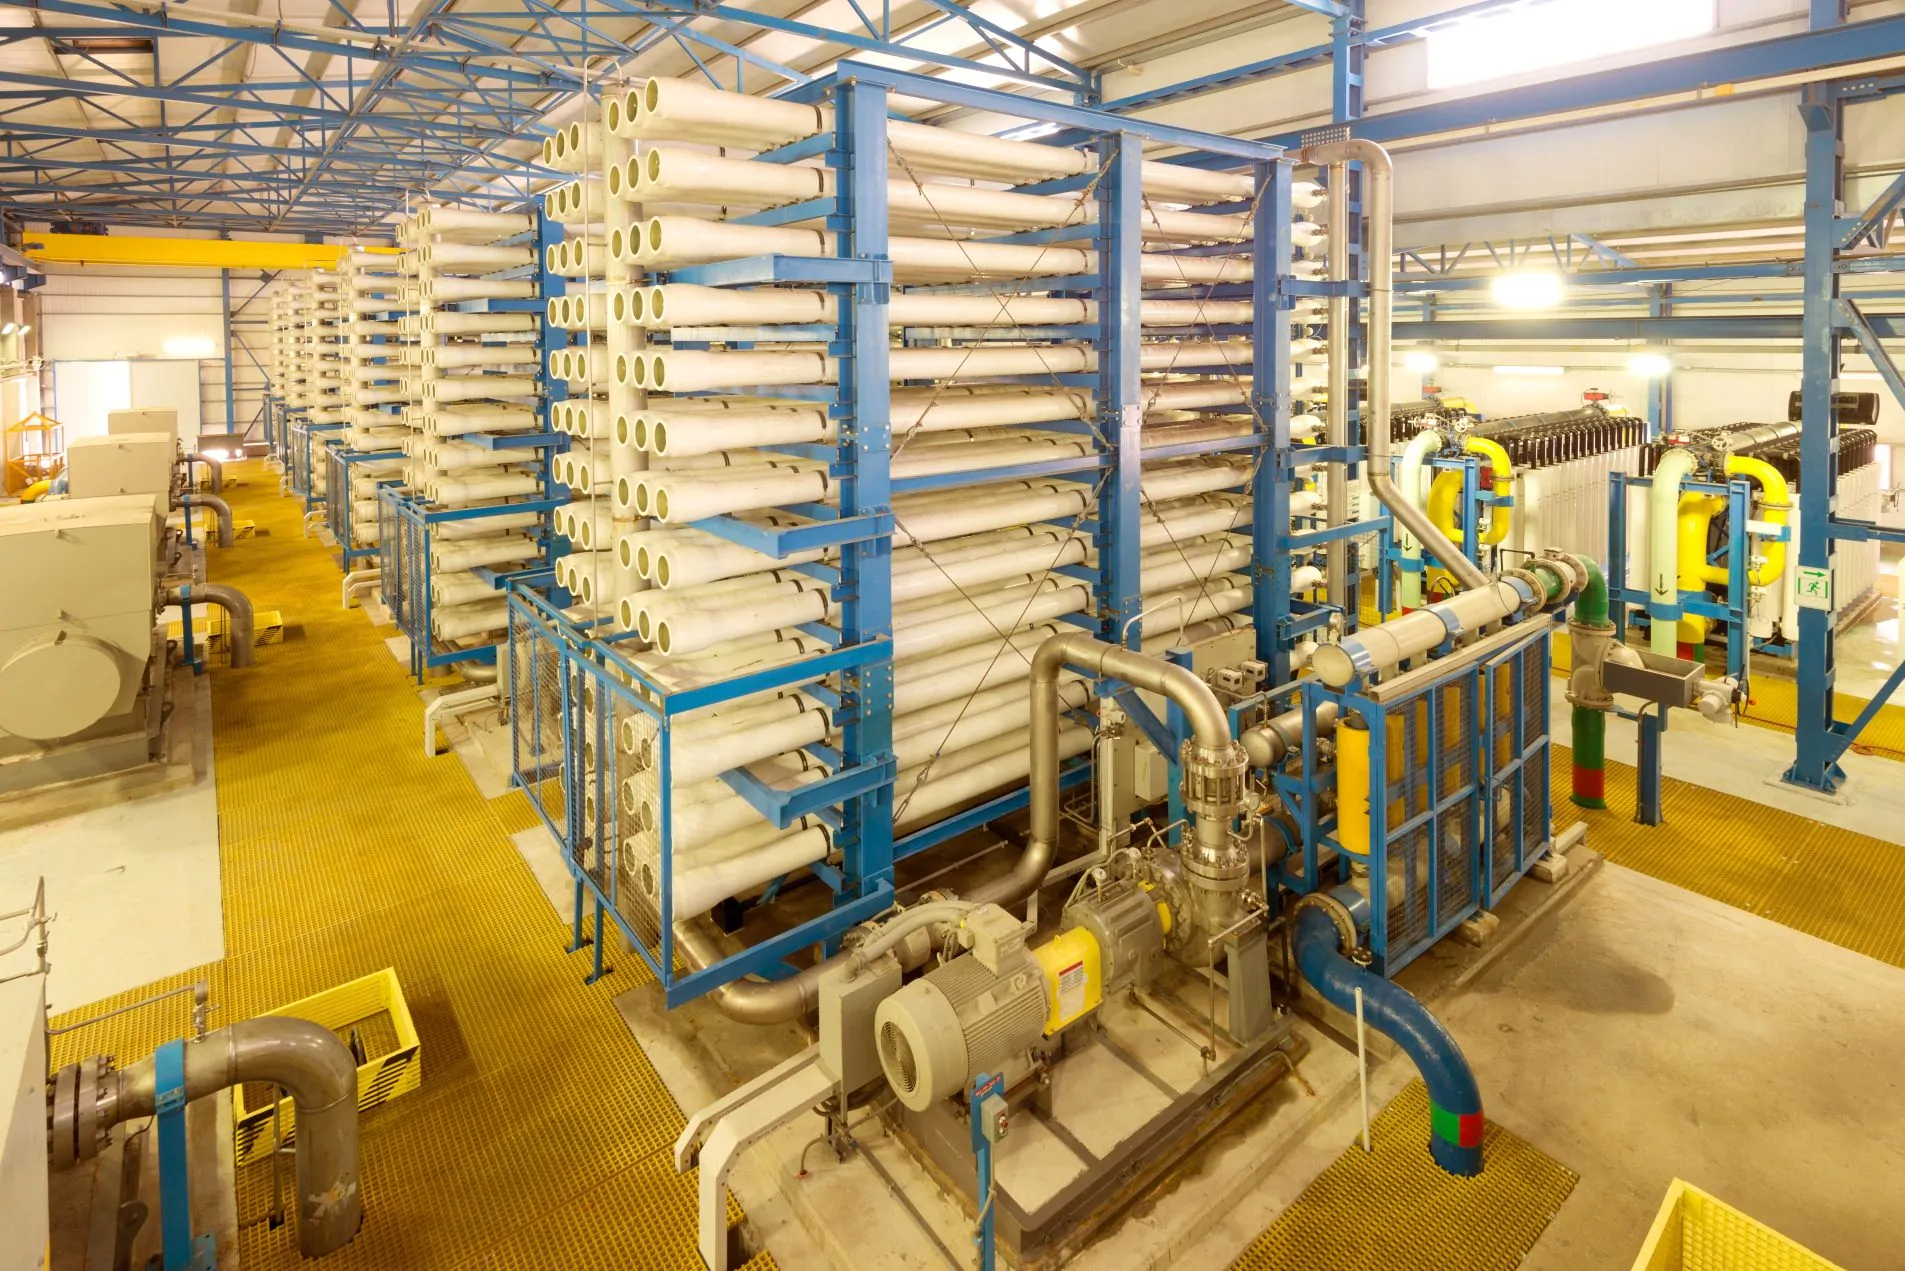
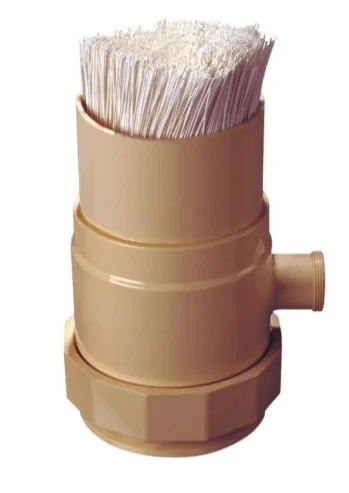
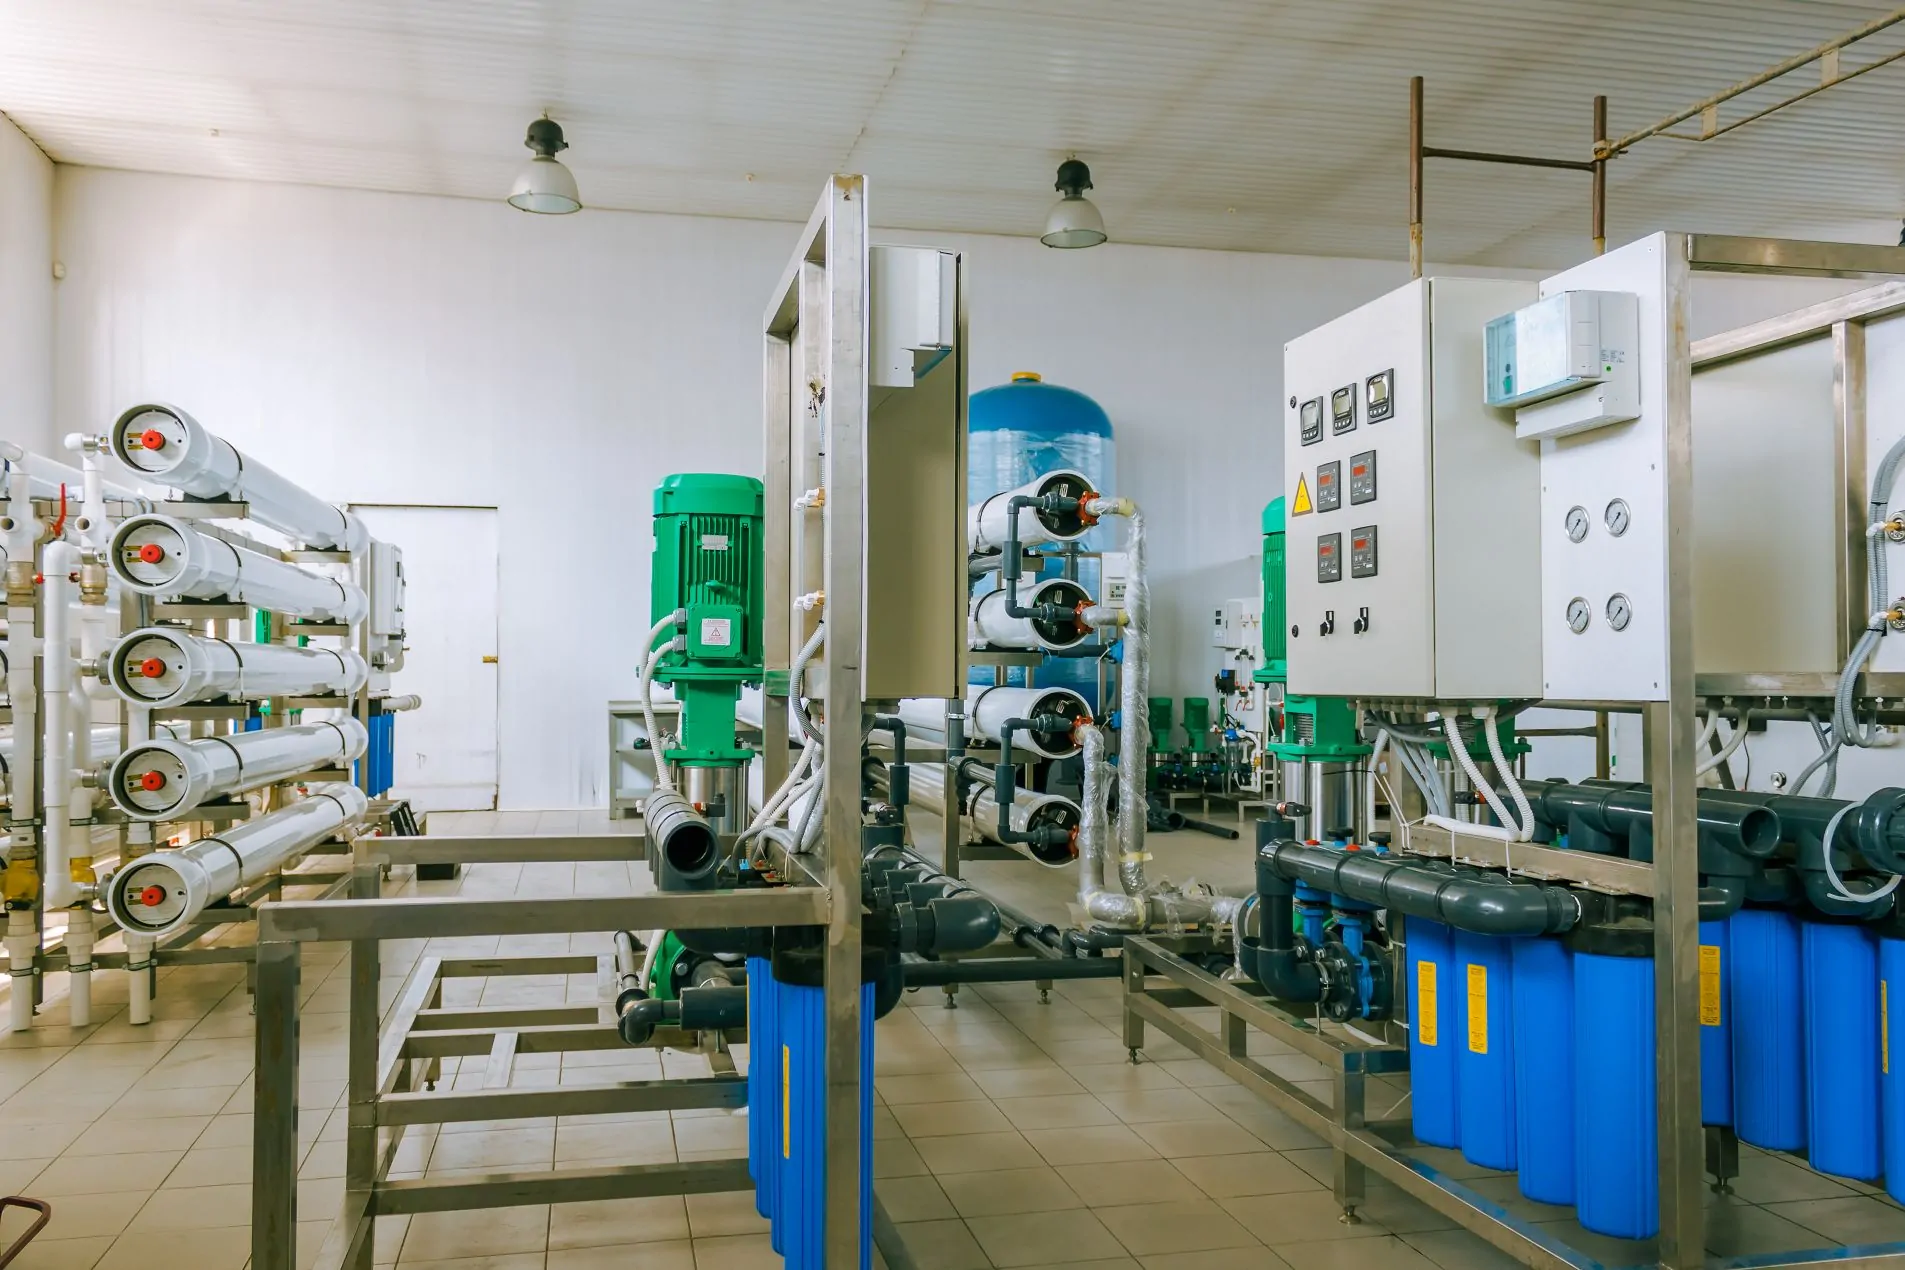
Microfiltration and Ultrafiltration
As previously outlined, clarification combined with multimedia filtration has long been common technology for makeup pretreatment, with a primary goal of suspended solids removal upstream of high-purity makeup water systems. Additional membrane technologies, most notably micro- and ultrafiltration, have emerged as methods to further reduce suspended solids loading on RO membranes and ion exchange resins. Applications have been extended to municipal water and wastewater treatment, food and beverage production, and the oil and gas industry. Often, these systems serve as direct replacements for conventional suspended solids clarification and multimedia filtration.
Figure 2.1 illustrates the filtration ranges of MF, UF, nanofiltration (NF), and RO. MF and UF are strictly for particulate filtration, while NF and RO remove dissolved ions.
There are three potential designs for MF/UF membranes:
Hollow fiber
Tubular
Spiral wound
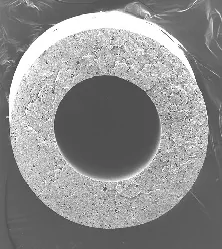
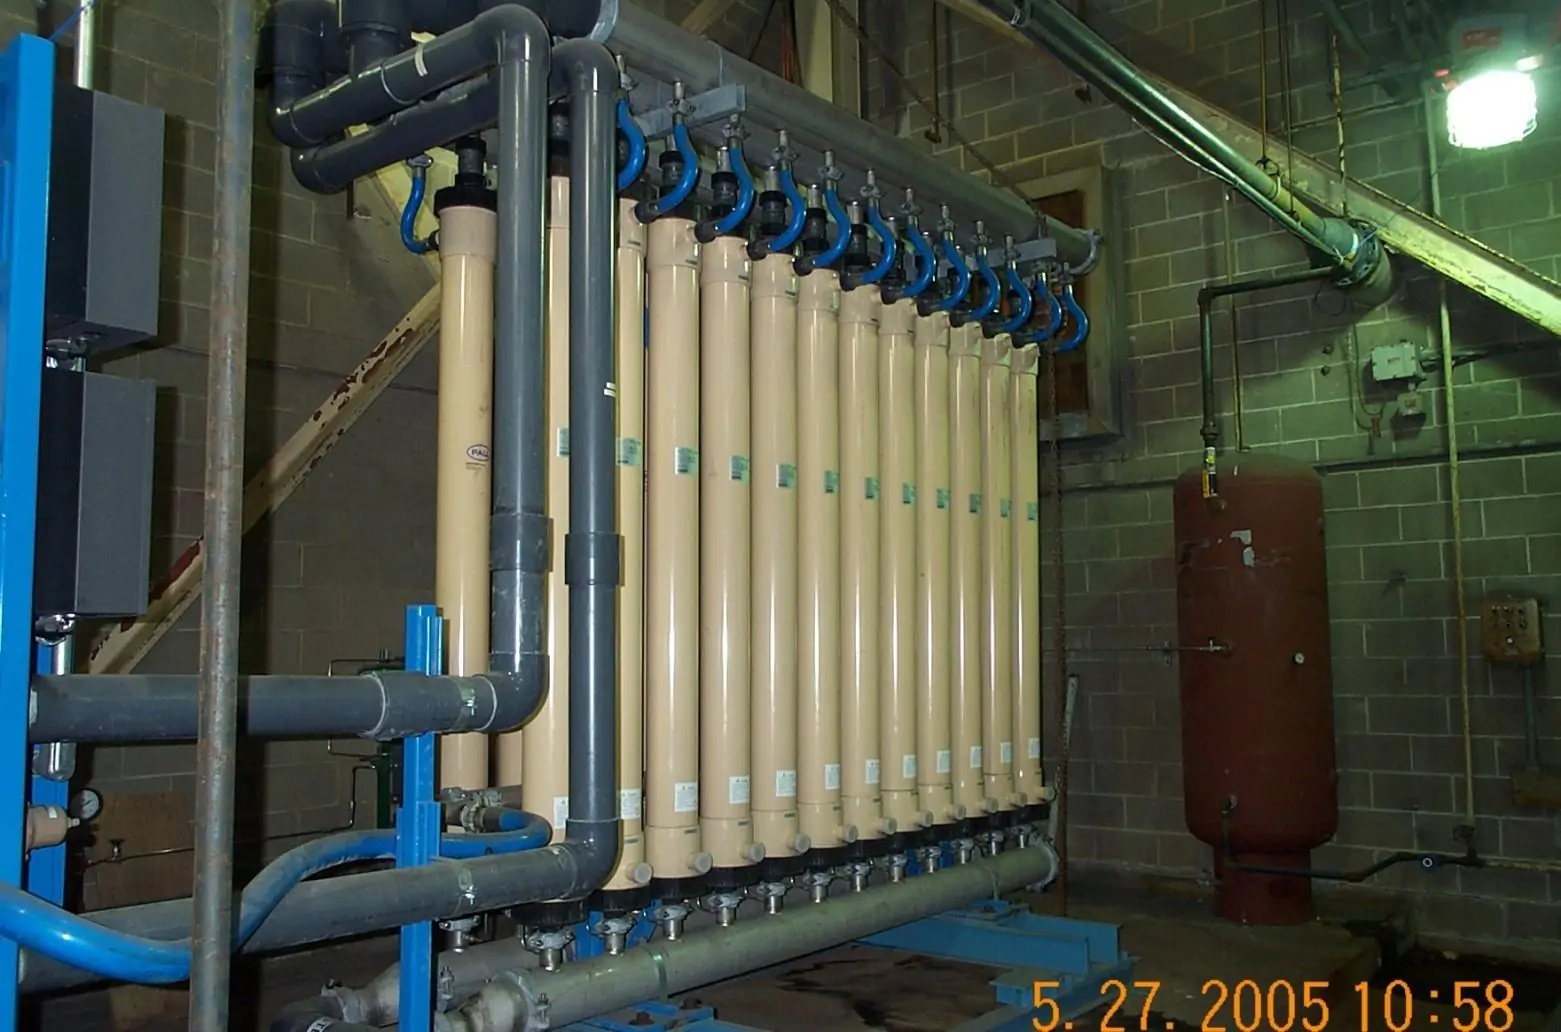
The hollow fiber design is most common, with pressurized and vacuum systems available. An example of a pressurized system is included below.
Figure 2.27. Cutaway view of the spaghetti-like hollow fiber membranes in an MF pressure vessel. Photo courtesy of the Pall Corporation.
An outside diameter of 0.7–1.5 mm and an inside diameter of 0.3–0.9 mm are the common dimensions for each membrane .
Figure 2.28. Magnified view of a single membrane from Figure 2.27. The flow path in these membranes is outside-in. Photo courtesy of the Pall Corporation.
The figure below shows the pressure vessel arrangement for a 300-gpm microfiltration system.
Figure 2.29. Pressure vessel configuration for a 300-gpm system. Photo by Brad Buecker.
Polyethersulfone (PES), polyvinylidene fluoride (PVDF), polypropylene (PP), and polysulfone (PS) are each examples of typical membrane materials, with PES and PVDF being the most common. Each is hydrophilic, meaning the lumen surface becomes completely wetted, offering resistance to organic fouling. PES has slightly superior permeability than PVDF. Regarding off-line cleaning, PES has a higher caustic tolerance (for removal of organics and microbiological matter during off-line cleanings), while PVDF has a higher chlorine tolerance and membrane durability. These are important factors when deciding which material is better for a particular water source.
The multimedia filters outlined earlier in the chapter can produce effluent with turbidity approaching 1 NTU, while MF and UF effluent is typically much cleaner. For example, a microfilter installed as a direct replacement to an aging clarifier lowered the turbidity of feedwater to an RO unit from 1.0 NTU to less than 0.05 NTU1. This led to dramatically-reduced RO cartridge filter and membrane cleaning, and extended membrane life.
Pressurized systems have an inside-out or outside-in flow path. In contrast, submersible designs, where membranes are suspended in a tank with the feedwater, utilize an outside-in flow path, with a mild vacuum drawing the water into the membranes’ central core.
Common criteria of membrane or system selection include:
Inside-out flow path is suitable for low concentrations of suspended solids.
Outside-in is superior for higher levels of suspended solids because of the better backwashing efficiency.
Submersible membranes are common for high TSS applications, such as wastewater/reclaim water treatment in a membrane biological reactor (MBR). The membranes are placed at the effluent end of the vessel to maximize residence time for the microbiological reactions to take place.
Outside-in membranes have a surface area approximately three times that of inside-out modules, while submersible systems typically operate at a lower flux rate than pressurized systems.
Flux rate represents the volumetric flow rate divided by the membrane surface area, and it is a key measurement of MF/UF output and performance. Common flux rate measurements are gallons/ft2/day, or liters/m2/hr. The achievable or required flux rate for any application depends upon the membrane manufacturer, flow path, membrane material, water characteristics, and water temperature. Flux is influenced by the trans-membrane pressure (TMP), which is the difference between the feed and filtrate pressures.
Calculating flux and TMP as a ratio provides thepermeability, expressed as gfd/psi, of the system, which can be used to determine operational performance.
J = Q/A
Where J = filtrate flux (gfd).
Q= filtrate flow in gallons per day (gpd).
A = membrane surface area (ft2).
TMP = ((PT + PB)/2) – PF
Where TMP = Transmembrane pressure (psi).
PT = Pressure of feedwater at the top of the filter (psi).
PB = Pressure of feedwater at the bottom of the filter (psi).
PF = Filtrate pressure (psi).
The term specific flux refers to filtrate flux that has been normalized for transmembrane pressure.
MF/UF utilizes a combination of crossflow and dead-end filtration where the feedwater flows parallel to the membrane surface, allowing particulates to accumulate within the membranes. The particles must be periodically removed with a backwash/air scour process. For example, in the system shown in Figure 2.29, the typical production sequence is 20 minutes followed by a one-minute backwash/air scour. While the backwash in this application is initiated on a timed basis, backwash triggered by a rise in TMP can also been considered as an alternative.
Some waters may contain impurities that cause fouling beyond the “normal” suspended solids which exist in surface waters or are present in the effluent of an upstream clarifier/softener system. For example, because of their small size, colloids may plug membranes. Fine iron particles can do the same. Organic coagulants or flocculants can adsorb on the membrane surface. Oil and grease are potential foulants as well, and they can quickly blind membranes and are difficult to remove. Microbiological fouling is also of concern. If the membranes are PES or PVDF material, however, oxidizing biocide feed upstream of the unit is common to minimize microbiological fouling.
An additional feature of MF/UF designs is chemically enhanced backwash (CEB). After a set number of standard backwashes, CEB is initiated. CEB introduces a chemical or chemicals to target troublesome foulants. For example, if iron oxides are a problem, citric acid is a common choice. Citric acid lowers pH but is a chelant that can solvate iron. If organic compounds and/or microbes are problematic, CEB will typically include caustic and bleach.
TMP trends and permeability studies are beneficial for establishing CEB frequency and chemical concentrations. Always consult and follow the manufacturer’s guidelines to evaluate the chemical tolerance of the membranes. A short, forward flush following a CEB is common to prevent residual chemicals from entering the produced water.
Despite the use of CEB, particulates will gradually accumulate, requiring a clean-in-place (CIP) procedure approximately once a quarter or at a similar interval. While CIP is an off-line procedure, it can typically be performed within a standard work shift. Many of the similar CEB chemicals, such as citric acid, caustic, bleach, are also used for CIP in higher concentrations. Examples include:
Caustic cleanings, pH target values vary for different materials of construction: 10–11 for PVDF and 11.5–12.5 for PES.
PVDF membranes generally have higher chlorine tolerance than PES.
With citric acid cleaning for iron particulate fouling, a reducing agent like sodium bisulfite (SBS) can alleviate inner pore fouling. Dosages range from 1–3% citric acid with 0.2–0.4% SBS.
Sometimes fouling may be so severe that a specialty chemical formula is required. These may be blends of surfactants, caustic, and chelants.
Best practice is to follow manufacturer’s guidelines when developing CIP procedures.
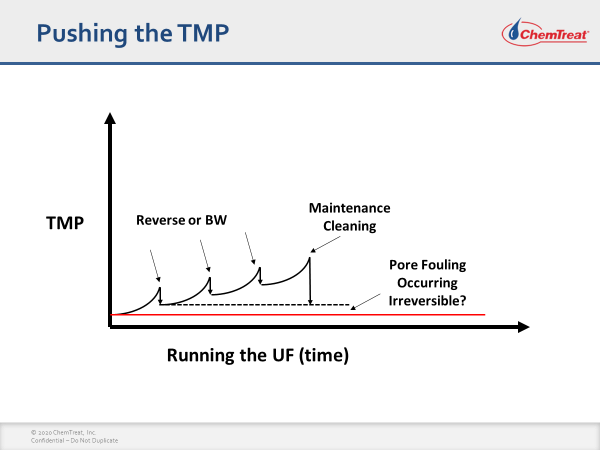
The key parameter in determining CIP frequency is an increase in TMP or a decrease in permeability. Figure 2.30 outlines a potential TMP performance curve over time. The temperature correction factor is applied to permeability data to account for seasonal variances and the determination of long-term membrane performance.
Figure 2.30. General outline of TMP increase and the effects of backwashing and
off-line cleaning.
With thousands of membranes in a typical hollow fiber unit, occasional membrane breaks are not uncommon. An increase in effluent turbidity may reveal a membrane failure. If suspected, the standard detection method is an offline pressure decay test or a vacuum hold test. These involve injecting air to the feed side of the membrane module and sealing the module. If the residual pressure is still within 90% of the initial pressure after five minutes, the test is successful. If not, an air bubble test is required to locate the broken membrane(s) and install a pin at the inlet end. It is important to note that some designs are more stable than others. For example, the unit shown in Figure 2.29 operated for years without a membrane failure.
Additional MF/UF Applications
MF and, particularly, UF are becoming more common as key components of potable water treatment systems. Membrane pores smaller than 0.1 micron can achieve total removal of pathogens like giardia cysts or cryptosporidium oocysts, which range in size from 3–10 microns. Fiber integrity is important, primarily due to issues related to human health. Any method that validates integrity must be sensitive enough to accurately and consistently detect a 3-micron defect. On-line membrane integrity testing is vital in ensuring water quality constantly meets potable regulations.
As discussed earlier in the chapter, MF and UF are becoming increasingly popular as a replacement for standard clarifiers (not lime-softening units). Because of this change, however, an issue of concern is TOC removal. If the raw water TOC concentration is significant, MF or UF alone may be insufficient to protect downstream equipment, as removal rates fluctuate between 20–80%.
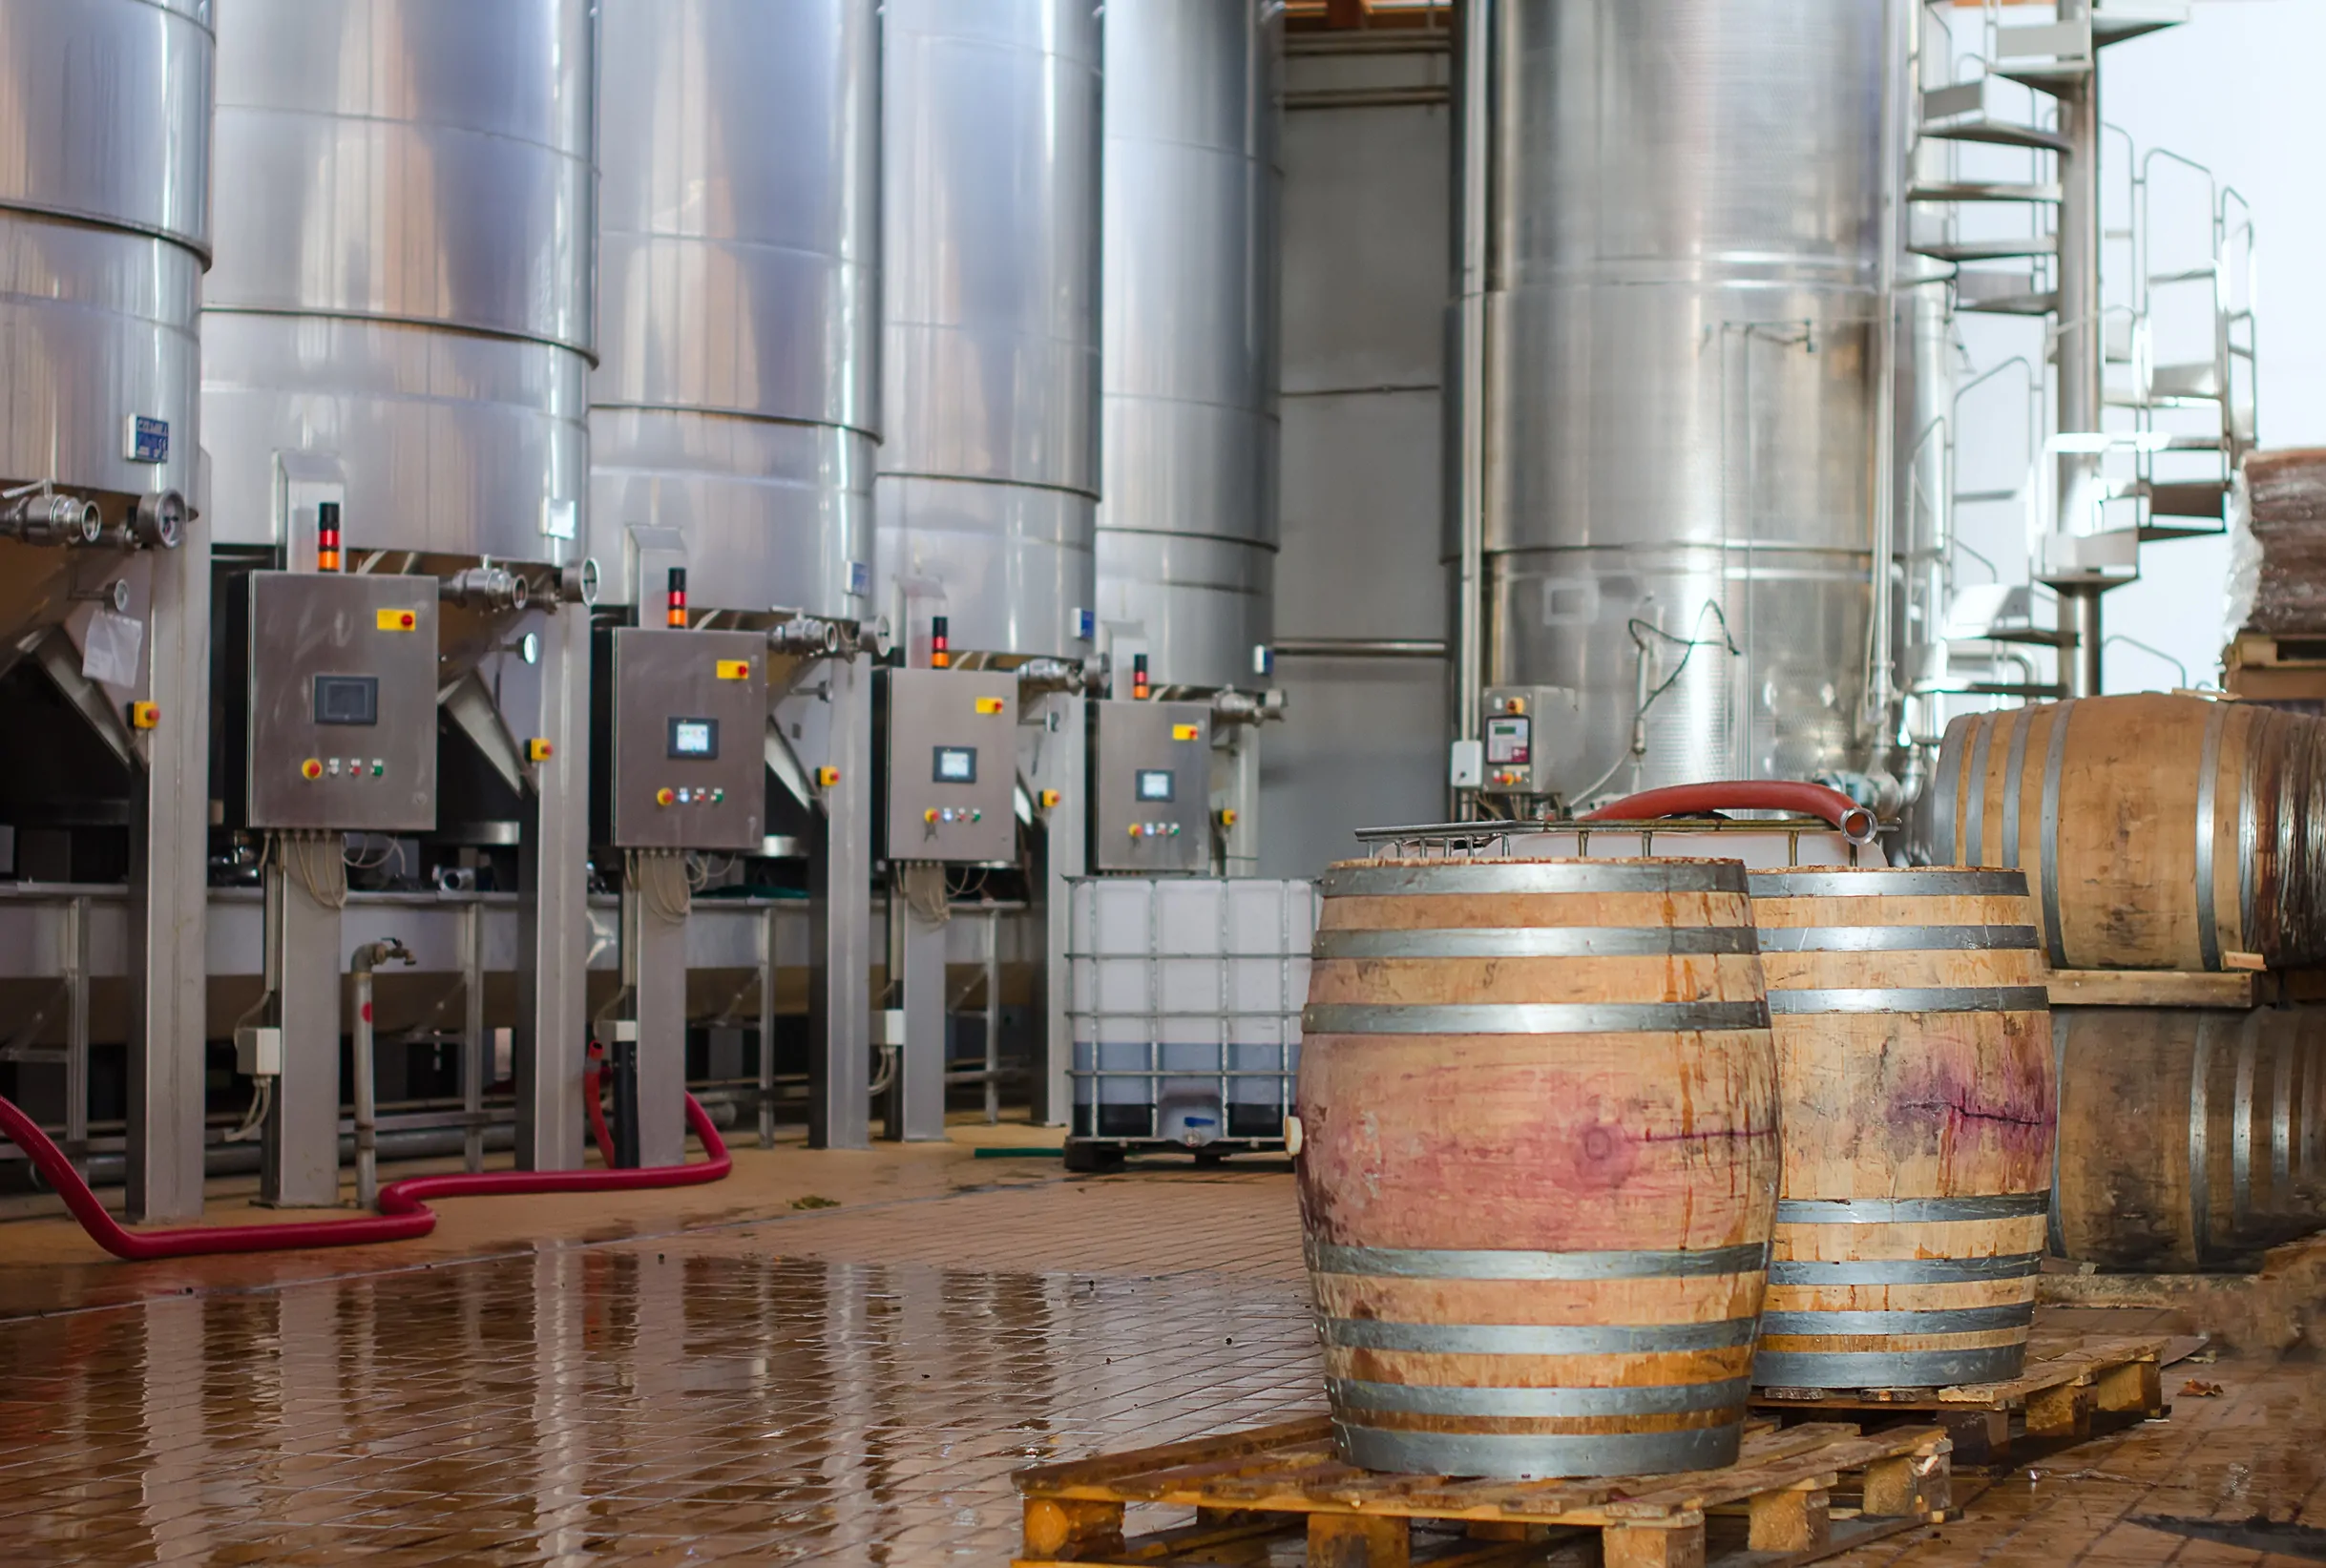
ChemTreat Helps Winery Improve RO System Efficiency and Reduce Cleaning Frequency
Reverse osmosis is commonly used for bulk demineralization, followed by ion exchange polishing. The primary material for most RO membranes is polyamide, which is susceptible to attack by oxidizing biocides, particularly chlorine. Typically, membranes can tolerate 1,000 ppm-hours of free chlorine, meaning that they could survive for 1,000 hours in a 1-ppm free chlorine environment or one hour in a 1,000-ppm chlorine environment, with any combination in-between. To maintain best practice, the oxidizing biocide should be removed prior to contact with RO membranes. (Oxidizers will also degrade ion exchange resins.) Transition metals such as iron, copper, or cobalt act as oxidizing catalysts and can accelerate membrane degradation.
Activated carbon filtration and reducing agent injection are the two primary methods used to remove oxidizing biocides from RO/demineralizer feed. As noted, oxidizing biocides react within the first few inches of the carbon bed, leaving the remainder of the bed as a breeding ground for the organisms that survive treatment. Accordingly, many modern systems do not have activated carbon filtration and rely on reducing agent injection to remove residual oxidizers. While many reducing agents are available, the two most common are:
Sodium bisulfite (NaHSO₃, the most common and inexpensive reducing agent, usually supplied as a 30% liquid solution)
Sodium metabisulfite (Na₂S₂O₅, granular form of sodium bisulfite)
The reactions of these two compounds are shown below.
2HOCl + 2NaHSO₃ → 2H₂SO₄ + 2NaCl Eq. 2-14
2HOCl + Na₂S₂O₅ + H₂O → 2H₂SO₄ + 2NaCl Eq. 2-15
The injection point should be as close to the RO cartridge filters as possible, preferably after the filters. Some organisms go into hibernation when contacted by an oxidizing biocide, then re-emerge once the biocide residual disappears. The microbes can then establish large colonies in RO pre-filters and membranes. Because of this, it is critical to have the dechlorination injection as close to the membranes or resin as possible.
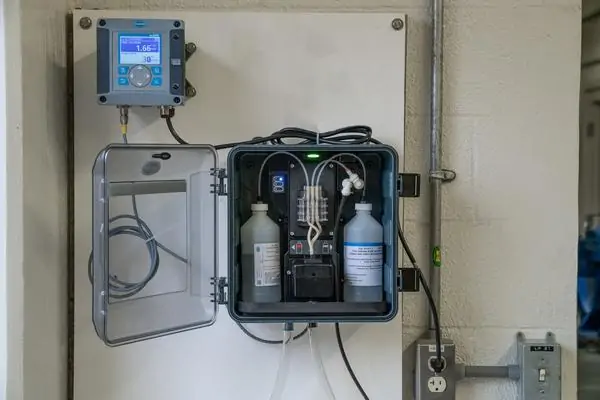
It is vital to conduct continuous monitoring following the reducing agent injection point. The primary measurement is chlorine residual, with oxidation-reduction potential (ORP) as a backup.
The primary goal is to implement an alarm system to detect any inconsistencies with reducing agent feed, ensuring the RO membranes are protected. For enhanced control,plant personnel can use analyzer signals to regulate the reducing agent feed. At a minimum, the signals could trigger an increase in feed should chlorine residual be observed at the analyzer.
ChemTreat RL1254 Solution Helps Beverage Plant Enhance Reverse Osmosis Membrane Efficiency While Improving Working Conditions
Well-designed, meticulously maintained, and professionally operated pretreatment systems are critical in preventing corrosion, fouling, and scaling in cooling water, high-purity makeup, and other systems in industrial and commercial facilities. Detailed historical raw water analyses are essential when designing a system. This ensures that the system is appropriately tailored to the raw water chemistry and its potential changes, thereby preventing the need for removal of inadequately designed systems.
Find Custom Makeup Water Pretreatment Solutions With ChemTreat
ChemTreat is committed to providing custom water pretreatment solutions designed by experts. Our innovative and customized water treatment solutions help improve efficiency and environmental compliance for businesses. Contact ChemTreat today to get in touch with your local representative to learn how ChemTreat can help your business.
Buecker, B., “Microfiltration: An Up and Coming Approach to Pre-Treatment for the Power Industry”; 26th Annual Electric Utility Chemistry Workshop, May 9-11, 2006, Champaign, Illinois.
Post, R., and Buecker, B., “Grey Water – A Sustainable Alternative for Cooling Water Makeup”; International Water Conference, November 4-8, 2018, Scottsdale, Arizona.
Hydranautics, “Chemical pretreatment for RO and NF”, Technical application Bulletin No. 111.
About the Authors
Katie Perrymam
Manager, Pretreatment
Katie Perryman, Manager, Pretreatment, has a B.S. in Chemistry from Virginia Polytechnic Institute and has worked in industrial water treatment since 2014, focusing on membrane separation and ion exchange. She is heavily involved in consultation and troubleshooting of pretreatment systems across multiple industries and applications. She has presented at multiple conferences and manages ChemTreat’s Early Career Training Program.
Brad Buecker
President of Buecker & Associates, LLC
Brad Buecker is President of Buecker & Associates, LLC and most recently served as Senior Technical Publicist with ChemTreat. He has over four decades of experience in or supporting the power industry, much of it in steam generation chemistry, water treatment, and air quality control. Buecker has a B.S. in Chemistry from Iowa State University. He has authored or co-authored over 250 articles for various technical trade magazines and has written three books on power plant chemistry and air pollution control. He serves on the Editorial Advisory Board of Water Technology and is a member of the ACS, AIChE, AIST, ASME, NACE (now AMPP), and the Electric Utility Chemistry Workshop planning committee.
Ed Sylvester
Director; Filtration, Ion Exchange & Membrane Technologies
Ed Sylvester started working in water treatment in 1976 while serving in the U.S. Navy. As Director of Ion Exchange and Membrane Technologies at ChemTreat, Sylvester has received company recognition for his involvement in energy savings projects and his support of customers in the ethanol, hydrocarbon, chemical, and middle market industries. His areas of expertise include pretreatment (membrane filtration, ion exchange, and clarification) and high-pressure boiler treatment.
Li Yang
Technical Consultant, Membrane Technologies
Li Yang holds a Ph.D. in Chemical Engineering from Nanjing Tech University and has been with ChemTreat since 2014. Her areas of expertise include antiscalant/cleaner formulation and application, membrane troubleshooting, and field support.
Oscar Echeverri
Technical Services Consultant
After earning his B.S. in Biology from Old Dominion University, Oscar entered the field of water treatment. He currently has over 23 years of industrial water treatment experience, with a strong background in the operations, service, and commissioning of pretreatment equipment and pure water applications.
Jean M. Gucciardi
ChemTreat Technical Staff Consultant, Retired
Jean Gucciardi worked in industrial water treatment for nearly four decades, focusing on influent, boiler, cooling, and wastewater applications. Gucciardi was published in multiple industry publications throughout her career. She earned a B.S. and an M.S. in Environmental Engineering from the University of Wisconsin.
David Marturana
Senior Technical Consultant
Dave Marturana has been working in industrial water treatment since 1981 and joined ChemTreat in 2008. He has a B.S. in Chemical Engineering and is a licensed Professional Engineer in the Commonwealth of Pennsylvania. An applications consultant for influent and industrial effluent water treatment, Marturana has extensive expertise in coagulant and flocculant selection and optimization, primary and biological wastewater treatment, municipal graywater treatment, and sludge dewatering applications.
Acknowledgements
The ChemTreat Water Essentials Handbook would not have been possible without the contributions of many people. See the full list of contributors.

 While applications such as cooling tower makeup or service water for washing plant infrastructure may be straightforward, other applications require high-purity water.