-
USA - English
- Locations
- SDS Access
- CTVista®+ Login

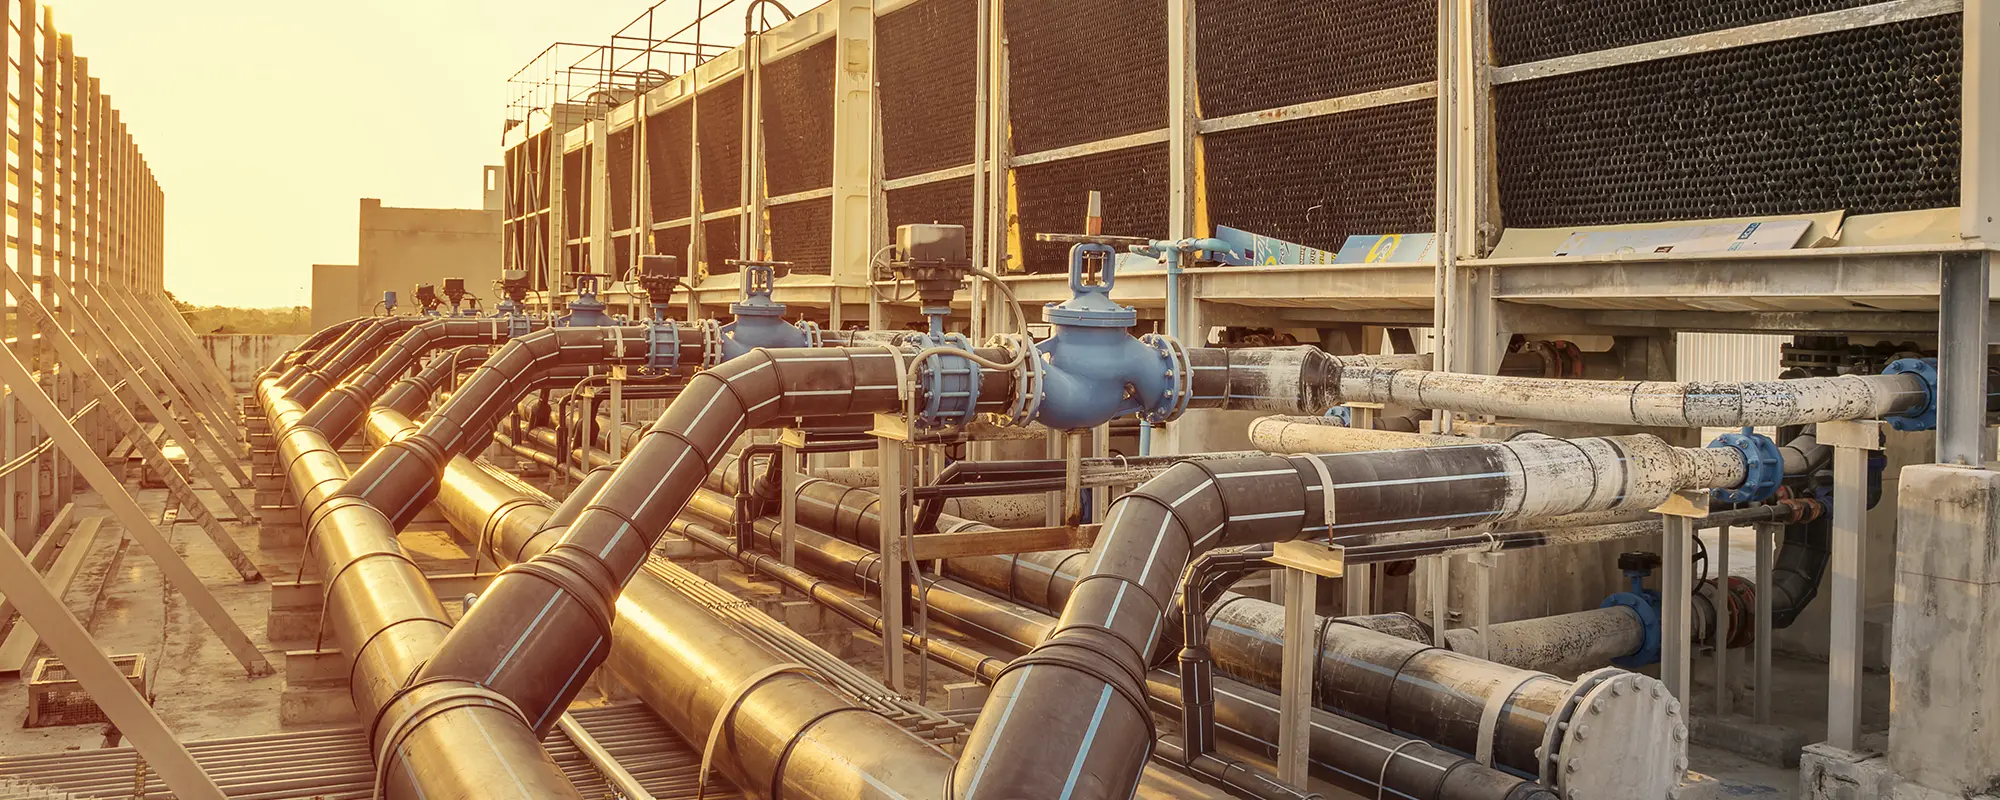
The cooling of process fluids, reaction vessels, turbine exhaust steam, and other applications is a critical operation at many industrial facilities. Cooling systems require protection from corrosion, scaling, and microbiological fouling to maximize performance, preserve equipment life and reliability, and most importantly, help ensure employee safety. In this chapter, we examine fundamental cooling system design and heat transfer basics.
The three major cooling system designs are once-through, open recirculating (cooling tower-based), and closed. The first two typically serve as primary cooling for the largest heat exchangers, with closed loops for auxiliary plant systems. The fundamentals of each are outlined below.
The cooling water in once-through systems comes from an external source such as a lake, river, or even the ocean. Once it has passed through the heat exchangers, the water is directly discharged back to the original source. A common example, particularly in the last century, is turbine exhaust steam cooling at large power plants, as shown below.
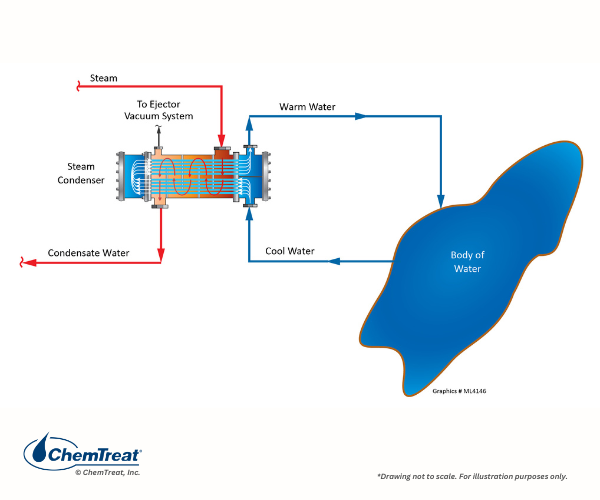
Figure 6.1. Basic once-through cooling schematic of a power plant condenser.
Once-through intakes are commonly equipped with bar screens and/or traveling screens to remove material like tree branches, leaves, and other large items, including aquatic life, that would foul condenser and heat exchanger tubes. Some existing intakes have been retrofitted with modern screens that minimize harm to aquatic life. However, cooling tower systems are now widely required, as once-through cooling is no longer permitted in many modern plants.
Note: While many nuclear plants have cooling towers, once-through backup systems are common for emergency cooling.
The discharge of warm cooling water to the supply source is an additional concern with once-through systems. Warm temperatures can be lethal to some organisms, while others, such as fish, will congregate at the discharge during cold weather months. Some plants were designed with discharge channels to allow the water to cool before entering the primary water body.
A spray system for discharge cooling has been used in some once-through applications. Similar to the cooling tower process, a spray system enhances cooling by evaporation of a small portion of the discharge.
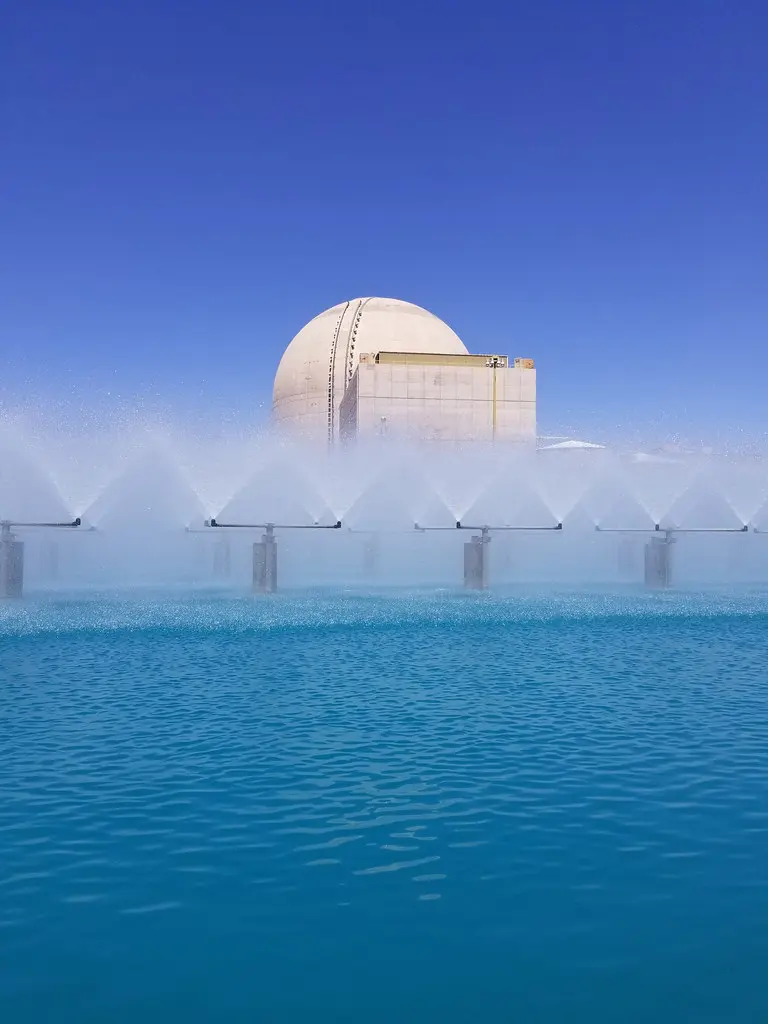
Figure 6.2. Spray pond.
“Grey Water Pond at Palo Verde” by NRCgov is licensed under CC BY 2.0.
Chemical treatment of once-through systems is often simple, but it is important to minimize micro- and macro-biological fouling and scale formation.
In recirculating cooling systems, the water is recycled continuously. The simplest form of a recirculating cooling system is a cooling pond. Most cooling is by sensible heat transfer with minor evaporative heat loss that increases on windy and warm days. Cooling ponds require a large footprint, making open-recirculating systems more common.
The ability to transfer large quantities of heat via a small amount of recirculating water evaporation is the basis behind cooling tower applications.
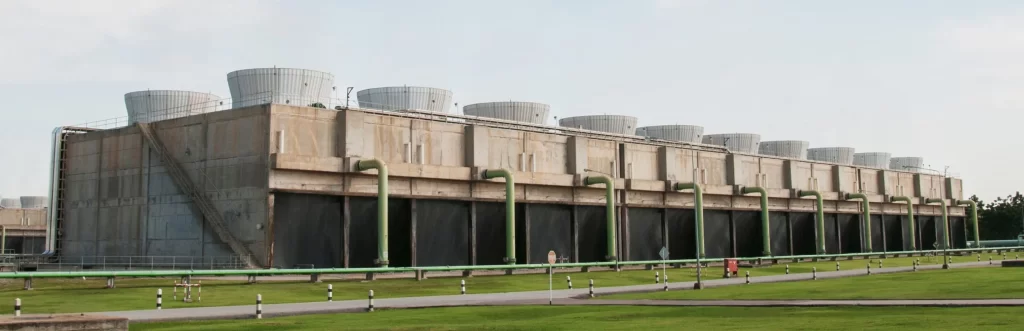
Figure 6.3. Photo of a counter-flow cooling tower.
The fundamental process is shown below:
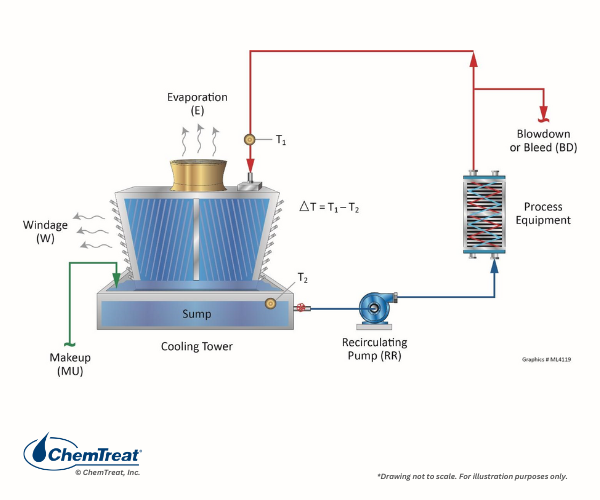
Figure 6.4. Fundamental cooling tower flow diagram.
Modern cooling towers are of two primary types, mechanical draft (fans move air through the tower) and natural draft (air flows naturally through the tower.) Natural draft hyperbolic towers, typically found at large coal or nuclear power plants, are far less common than mechanical-draft towers.
Mechanical-draft towers can be designed and assembled in cells that sit side-by-side within a common structure. Individual cells may be placed into or taken out of service to handle changing loads. The towers may be either forced-draft, in which the fans push air through the tower, or induced-draft where the fans pull the air through.
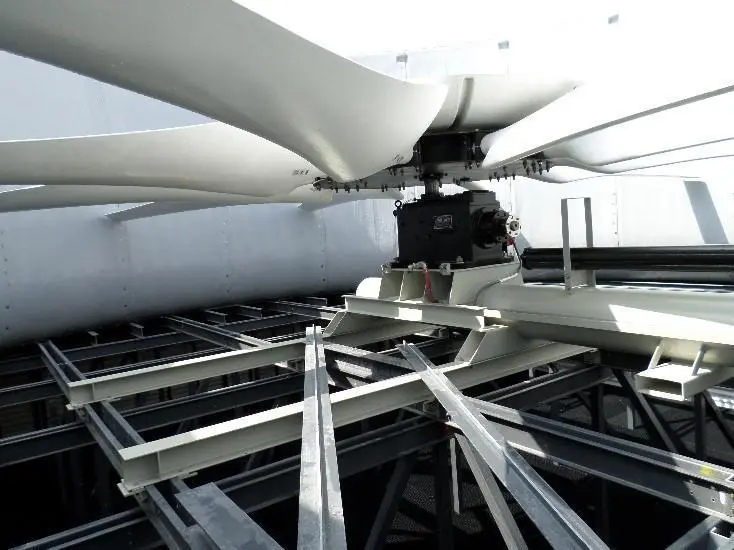
Figure 6.5. An induced-draft fan in the exhaust hood of a cooling tower cell. Photo courtesy of International Cooling Tower.
Most large industrial towers are induced-draft, but smaller units are often forced-draft to simplify operation. In forced-draft towers the air velocity decreases during air passage through the tower. The lower velocity can lead to recirculation of exhaust air to the tower inlet, reducing efficiency.
Another primary differentiation is crossflow or counter-flow, in which the air flows perpendicularly or counter-currently to the water flow path.
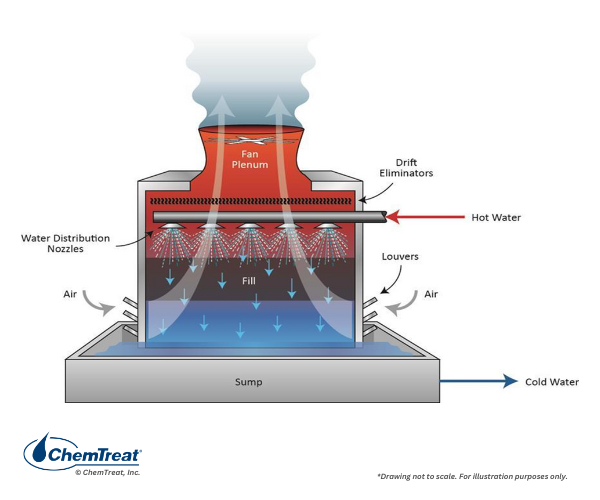
Figure 6.6a. Schematic of an induced-draft, counter-flow cooling tower. Air flow is opposite water flow.
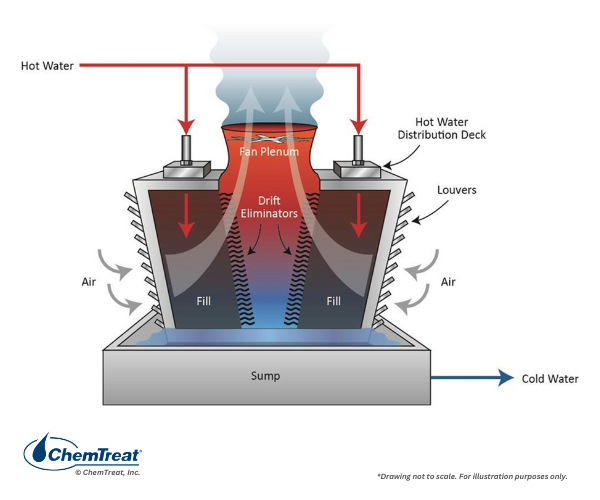
Figure 6.6b. Schematic of an induced-draft crossflow cooling tower. Airflow is perpendicular to water flow.
Note that the towers shown in both Figures 6.6a and 6.6b are dual-entry types, where the air enters from opposite sides. These are more efficient than single-entry towers, where wind direction has a greater impact on efficiency. Large towers are often placed to take advantage of prevailing wind patterns. Occasionally, one might see an octagonal or circular tower for maximum efficiency regardless of wind direction, but the design and construction costs of these towers are greater than for standard rectangular towers, making them less common.
The tower components shown in the previous illustrations are critical for successful structural stability and operation.
Depending on size, age, and other factors, the structural support and internal components of cooling towers may be comprised of several materials. Knowledge of the various materials for any application is important for optimizing water treatment.
In the past, large cooling towers had wooden support structures. Pressure-treated Douglas Fir and Redwood were the two most common choices. These materials are affordable, decently strong, and easy to cut precisely on-site. However, they do have disadvantages:
The replacement for wood in many modern, large industrial towers is fiberglass reinforced plastic (FRP).
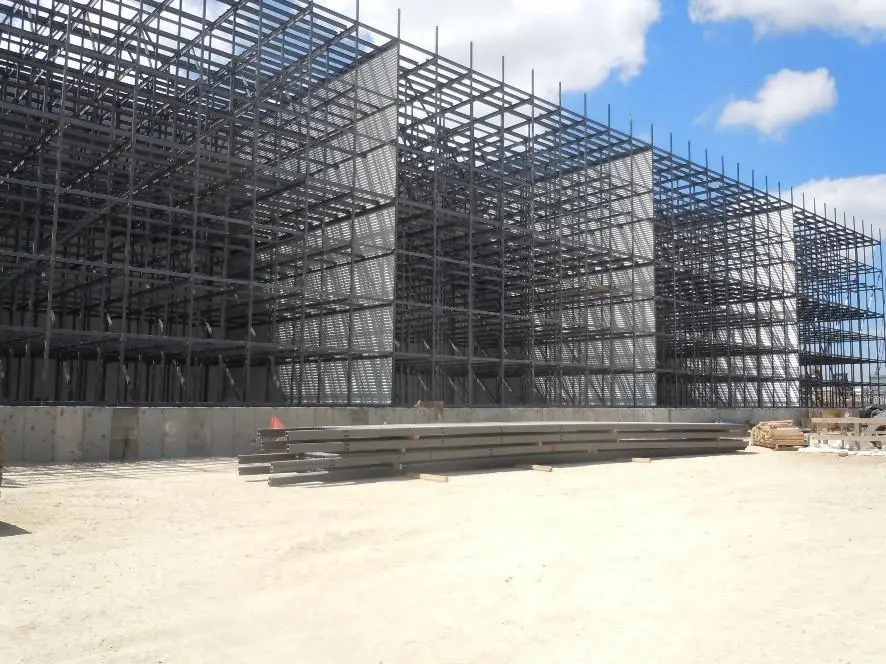
Figure 6.7. FRP support structure for a counter-flow cooling tower. Photo courtesy of International Cooling Tower.
Benefits of fiberglass include:
Limitations of fiberglass include:
Large cooling towers commonly include a concrete water basin, as illustrated in Figure 6.8, which may encounter corrosion issues.
For smaller cooling towers, such as those at commercial buildings, galvanized steel is a common structural material. Small towers can often be fabricated on one skid in the supplier’s shop and shipped to the site directly.
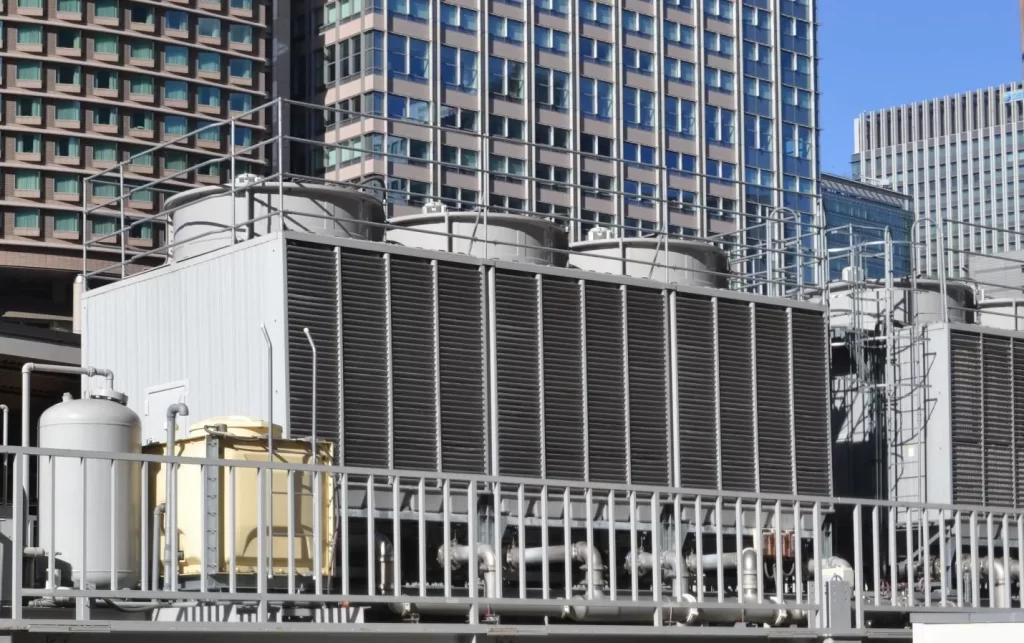
Figure 6.8. A package cooling tower.
Galvanized towers may have a carbon steel basin. Other small towers may be fabricated from stainless steel, sometimes in the mistaken belief that stainless is resistant to all forms of corrosion.
The primary method of heat transfer in a cooling tower is evaporation of a small portion of the recirculating water. Correct fill selection is key to maximizing heat transfer (within various water quality restraints as we shall see). Proper selection lowers the liquid-to-gas (L/G) ratio for the tower, and reduces the size and material/operational costs of the tower and of auxiliary equipment, such as recirculating pumps and fans.
Early cooling towers had wooden splash fill; a series of staggered slats below the water spray or distribution nozzles.
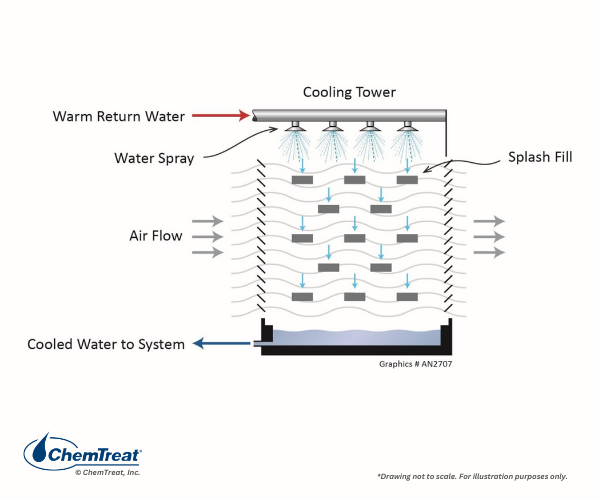
Figure 6.9. General schematic of early wooden splash fill in a crossflow cooling tower.
Water impinging on the slats breaks into small droplets that increase the surface area.
Splash fill is common for crossflow towers, and the technology has been considerably improved, with a modern design shown below.
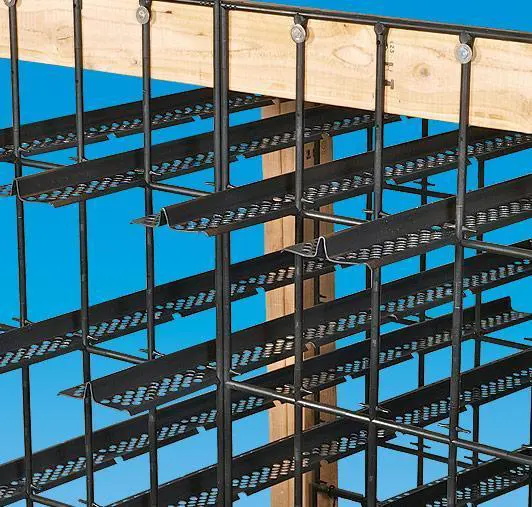
Figure 6.10. A modern splash fill arrangement.
Source: Brentwood Industries and Rich Aull Consulting.
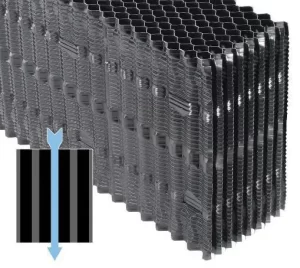
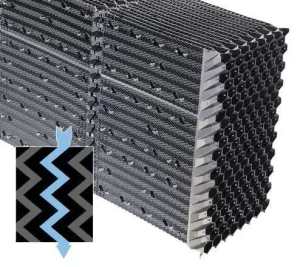
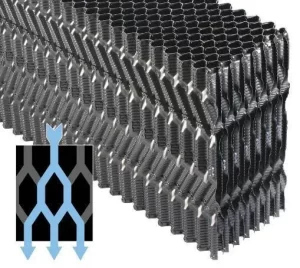
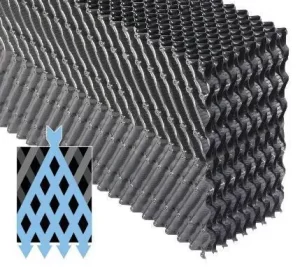
Splash fill is commonly used in cooling towers when water has a high tendency to foul, while film fill is often selected in other situations because it increases air-water contact. Typical film fills are made of PVC for low cost, durability, good wetting characteristics, and inherently low flame spread rate. Film fill is not generic in nature, and numerous designs are available. The choice of flow configuration and the spacing between the fill sheets (flute size) must be evaluated carefully and are dependent upon the projected quality of the recirculating water. The following illustrations outline several film fill styles ranging from a low-fouling design for waters with strong fouling potential to high-efficiency types.
|
Figure 6.11a. Vertical Flutes (VF). Courtesy of Brentwood Industries and Rich Aull Consulting. |
Figure 6.11b. XF Stand-off. Courtesy of Brentwood Industries and Rich Aull Consulting. |
Figure 6.11c. Offset Flutes (OF). Courtesy of Brentwood Industries and Rich Aull Consulting. |
Figure 6.11d. Cross-Flutes (CF). Courtesy of Brentwood Industries and Rich Aull Consulting. |
Figures 6.11a–d show a progression of various film fill configurations moving from low efficiency and corresponding low fouling potential to high efficiency and high fouling potential.
Cooling tower manufacturers are enhancing efficiency; however, a more complex flow path can also result in additional locations for solids deposition. The following table outlines general guidelines for some of the designs shown above.
Source: Reference 2
| 19 mm CF | 21 mm OF | 19 mm VF | 25 mm M/S | 38 mm VF | 19 mm XF- Standoff4 | |
| Allowed TSS (ppm) with Good Microbial Control2 | <100 | <200 | <500 | <1,000 | No Limit | <500 |
| Allowed TSS (ppm) With Poor Microbial Control3 | <25 | <50 | <200 | <500 | <1,000 | <200 |
| Allowed Oil and Grease (ppm) | None | <1 | <5 | <50 | <25 | <5 |
| Fibers | None | None | None | None | None | None |
Figure 6.12 illustrates the effect of water velocity on the depth of biofilms.
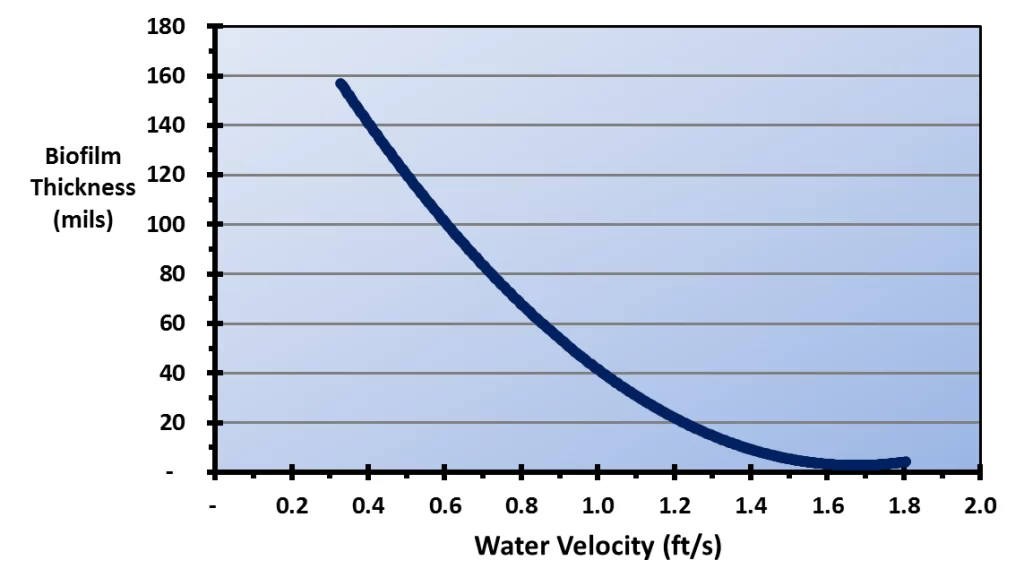
Figure 6.12. Biofilm thickness as a function of water velocity (Reference 3, 4)
A comparison of this illustration with the types of cooling tower fill shown above highlights the vulnerability of cellular plastic film packs to biofouling. The water film velocity in typical cross-fluted film packs has been reported to be only 0.48 ft/s, and for fouling-resistant film packs, only 0.89 ft/s–0.95 ft/s for an 8 gpm/ft2 water loading rate.
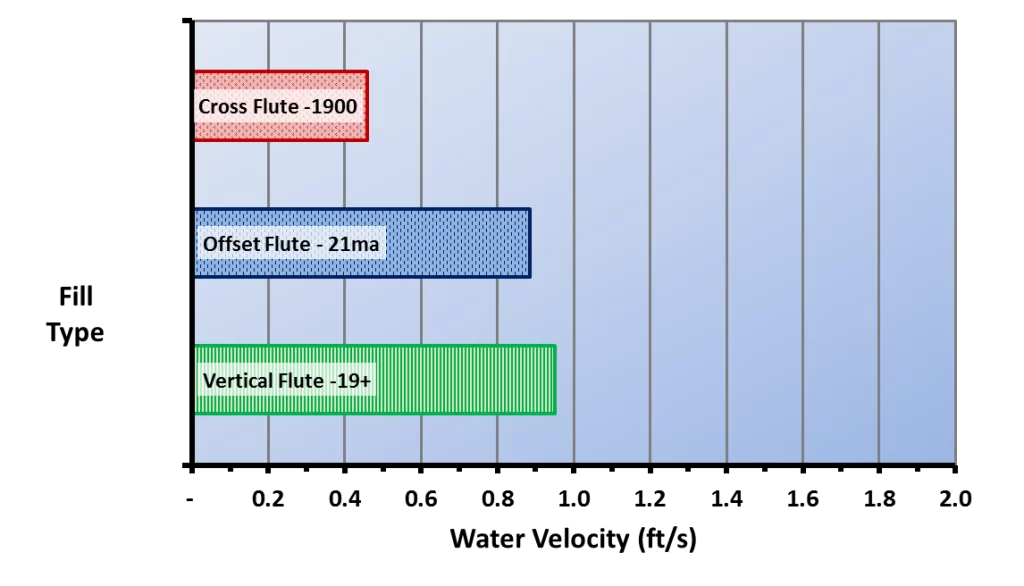
Figure 6.13. Water film velocity for typical cellular plastic fill packs of cross-fluted and fouling-resistant designs. (Reference 3, 5)
Biofilms collect suspended solids that enter the tower through the makeup and air flow to produce mud-like deposits that can become very thick.
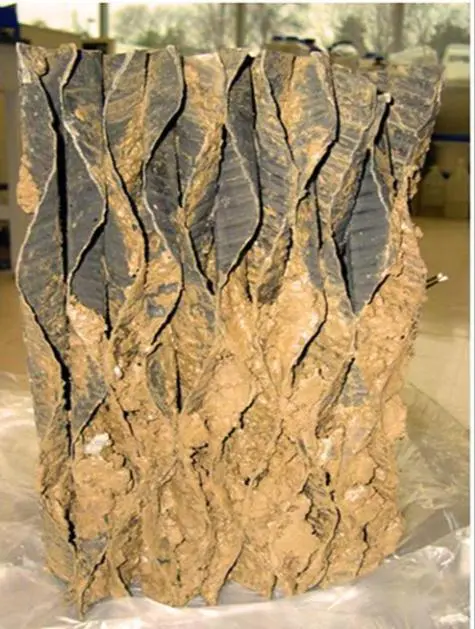
Figure 6.14. An extracted section of film fill with microbiological/silt deposits.
The deposits can close off fill passages, which reduces air-water contact and degrades heat transfer. Deposition can also add enormous weight to the fill. Both effects are shown below.
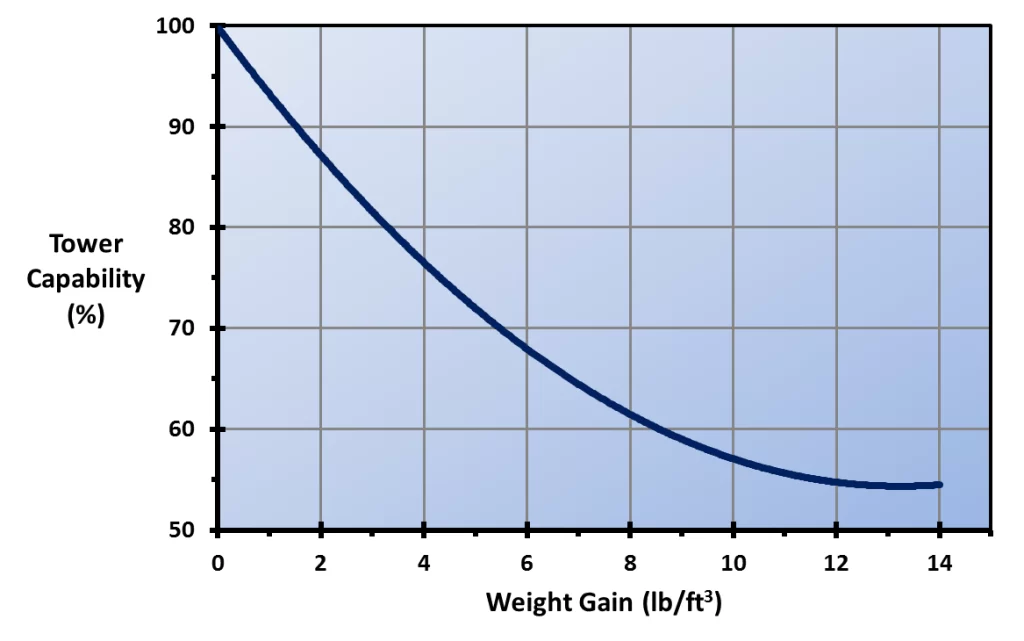
Figure 6.15. Tower capability loss vs. fill weight gain for a standard offset flute cellular plastic fill pack. (Reference 3, 6)
In extreme cases, fouled fill has collapsed, resulting in an unscheduled outage and large replacement costs.

Microbiological colonies tend to accumulate in the middle of the fill pack. Water velocities directly under the spray nozzles are generally high enough to discourage microbe adhesion. Fouling is typically more pronounced in the middle of the fill, as suspended solids are filtered out before reaching the bottom, and the lowest layer does not support soft deposits. The lack of observable microbial colonies on the upper or lower surfaces of the fill, coupled with challenges in assessing the intermediate layers, frequently results in fouling developing unnoticed until it is well advanced. Personnel at power plants and industrial facilities have attempted to monitor fill fouling during tower operation using sections of fill suspended from load cells, or by cutting an access window into the end of the tower casing to allow a middle section to be removed periodically for inspection using a man lift, or by suspending a section of fill beneath the main fill pack to allow it to be easily inspected and weighed. While these monitoring techniques demonstrate some degree of effectiveness, none have yet been shown to provide completely satisfactory results.
Several methods exist for removing biological or silt deposits from cooling tower fill, including hyper-halogenation, although its effectiveness may be limited. High chlorine levels can corrode system components and, after cleaning, the waste may need treatment before discharge. Microbiological colonies have high water content and will shrink and detach from surfaces when thoroughly dried. US Patent 5,558,157 outlines this method for biofilm removal in shell and tube heat exchangers. However, drying out cooling tower fill can prove problematic even with the help of fans. Chlorine dioxide has also served as a cleaner for cooling tower biofilms with some success.
Hydrogen peroxide (H2O2) is the most utilized and effective cleaning agent for removing microbiological deposits. Peroxide is effective because of its oxidizing strength and from the physical action of oxygen micro-bubbles produced as it reacts with organic deposits. The decomposition products of peroxide are water and oxygen and the compound has a very positive environmental profile. Typical dosages are in the 500–3,000 ppm range of active chemical. As with most cleaning processes of this type, addition of low levels of surfactants will help loosen deposits. Polymeric dispersants are often included to keep dislodged solids in suspension until they can be discharged.
Mist Eliminators
Air and water mixing in the tower forms fine droplets that may exit the tower in the plume, commonly referred to as “drift.” Moisture discharge is problematic for two reasons. First, solids within the droplets can deposit on induced-draft fan blades and gradually impact performance. Secondly, plant air emissions regulations commonly include cooling tower discharge. A facility may be in violation of discharge guidelines from the solids entrained in the droplets. Accordingly, chevron-vane mist eliminators are standard cooling tower items. The demisters collect water by impingement and allow the water to drain back into the tower.
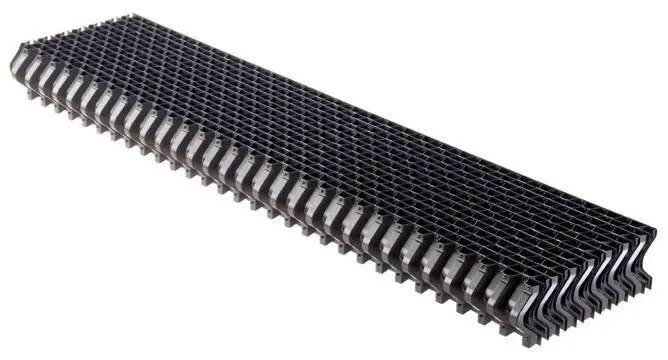
Figure 6.16. A modern mist eliminator design.
Photo courtesy of Brentwood Industries and Rich Aull Consulting.
Modern demisters can lower entrained moisture to below 0.0005% of the recirculating water rate. For example, a cooling tower operating at a recirculation rate of 100,000 gpm with a drift rate of 0.0005% would result in a drift of 0.5 gpm.
The effective operation of a tower relies significantly on the proper design of its water distribution system. The figure below shows a portion of a modern spray system for a counter-flow tower.
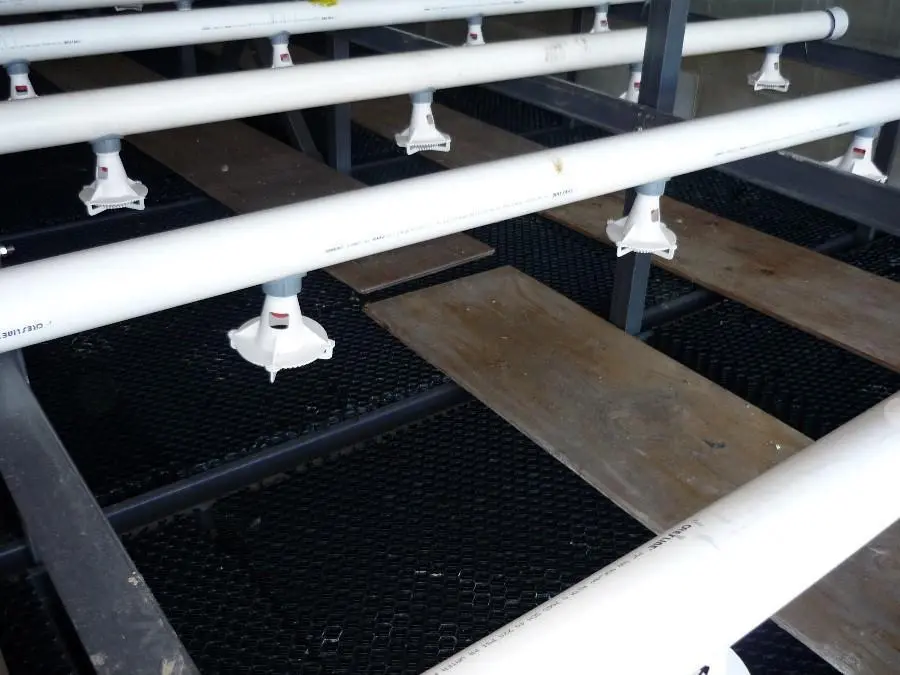
Figure 6.17. Photo of several laterals and spray nozzles above counter-flow packing in a new tower. The planks were removed before tower startup.
Photo courtesy of International Cooling Tower.
Crossflow towers typically have a distribution deck above the fill, where a stable level of water is maintained on the deck surface. The water flows onto the fill via a precise pattern of deck perforations.
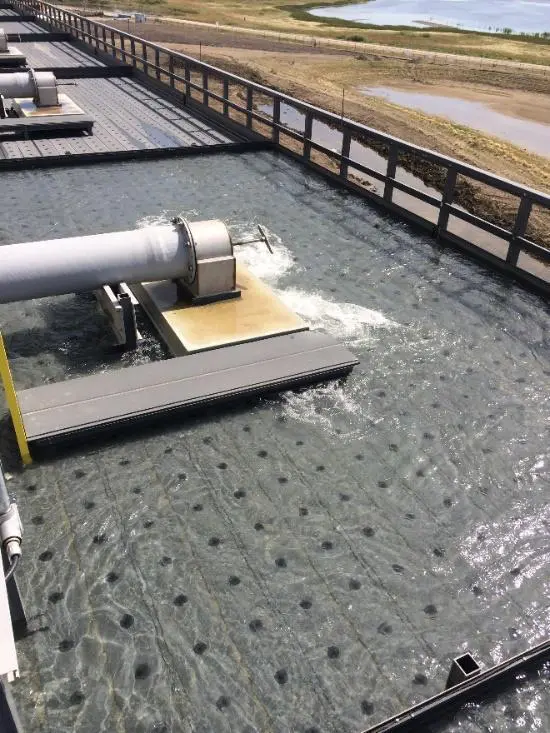
Figure 6.18. The distribution deck of a circular, crossflow cooling tower. Note the uniform perforations.
Photo courtesy of International Cooling Tower.
Fill requires uniform water distribution to minimize channeling. Channeling on its own will reduce tower efficiency, but it can also establish low-flow locations that allow increased deposition and formation of microbiological colonies. In counter-flow towers with water distribution networks, regular inspections should include examination of the spray nozzles to find plugged, broken, or missing nozzles. For crossflow towers, plugging of the distributor deck perforations by solid materials or algae can cause maldistribution.
Normally, recirculating systems are designed with multiple pumps so the water flow rate can be adjusted for seasonal temperature changes. In typical multi-cell towers, cells can be placed in or removed from service depending upon cooling requirements.
As noted, most large cooling towers have induced draft fans. Beyond size and motor horsepower, fan speed and blade pitch are important elements to consider. Fan air flow can stall if the fan settings are not correctly configured. Regular monitoring and maintenance are important, as fans may become unbalanced and misaligned from the accumulation of deposits that exit with the plume. Additionally, gearboxes require regular inspection and lubricant monitoring.
A frequently implemented configuration is dual-speed fan control, or, for enhanced operational flexibility, the utilization of variable frequency drive (VFD) control. Rather than placing a cell or cells in or out of service to adjust for load or ambient air temperature changes, the fan speed can be modified. This adjustment may be particularly beneficial during the winter to minimize icing. Inlet louvers can also be adjusted to modify air flow.
In the past, hyperbolic cooling towers were commonly used at large power plants because they could be included in overall plant costs and did not require fans.
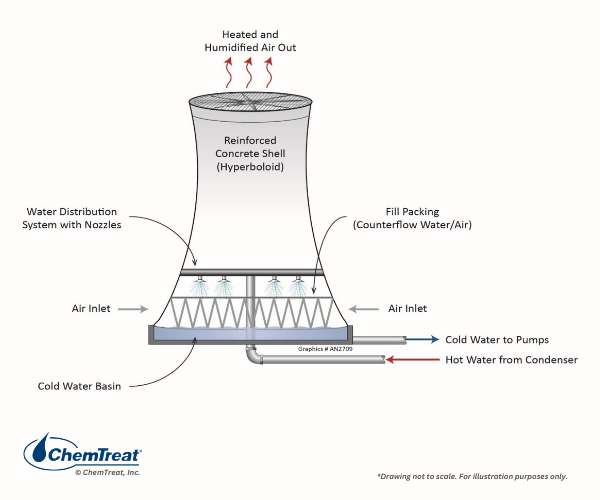
Figure 6.19 Hyperbolic or “Natural Draft” Cooling Tower.
As the figure indicates, hyperbolic towers are very large, tall structures; fabricated from concrete. The design allows natural airflow (from any direction) and structural stability. The public often confuses hyperbolic towers with nuclear power plants when there is nothing “nuclear” about the towers, some of which were installed at large coal plants. Very few hyperbolic towers have been constructed in the last few decades, however.
As air passes through a cooling tower, it induces evaporation. The evaporated water consumes a large amount of energy during the change in state from a liquid to a gas. This is known as the latent heat of vaporization, which at sea level is typically around 1,000 Btu/lb.
A key concept in comprehending heat transfer within cooling towers is the “wet bulb” temperature. Consider being outdoors, but in the shade, on a 90°F day at 40% relative humidity. A standard thermometer would read 90°, which is the “dry bulb” temperature. Now, imagine if we placed another thermometer alongside the dry bulb thermometer, but in this case have wrapped a soaked piece of cloth around the bulb of the second thermometer, and have put both on a swivel such that the thermometers can be swirled very rapidly through the air. This instrument, a simple and common device, is known as a sling psychrometer.

Figure 6.20. Illustration of a vintage sling psychrometer.
Photo courtesy of Rich Aull Consulting.
After a short time, the dry bulb thermometer will still read 90°F but the other thermometer will read 71.2°F. This latter reading is the wet bulb temperature, and it is the lowest temperature that can be achieved by evaporative cooling. Modern psychrometers are mechanically aspirated (fans move air across the wetted wick) and are even more precise.
Regardless of efficiency, a cooling tower cannot reduce the temperature of recirculating water to the wet bulb temperature, and practical constraints such as cost and space ultimately limit the feasible size of a cooling tower. The separation in temperature between the chilled water and wet-bulb value is known as the approach.
A graphical representation of range and approach is illustrated below. 1 These values will be variable over the wide range of conditions in which cooling towers operate.
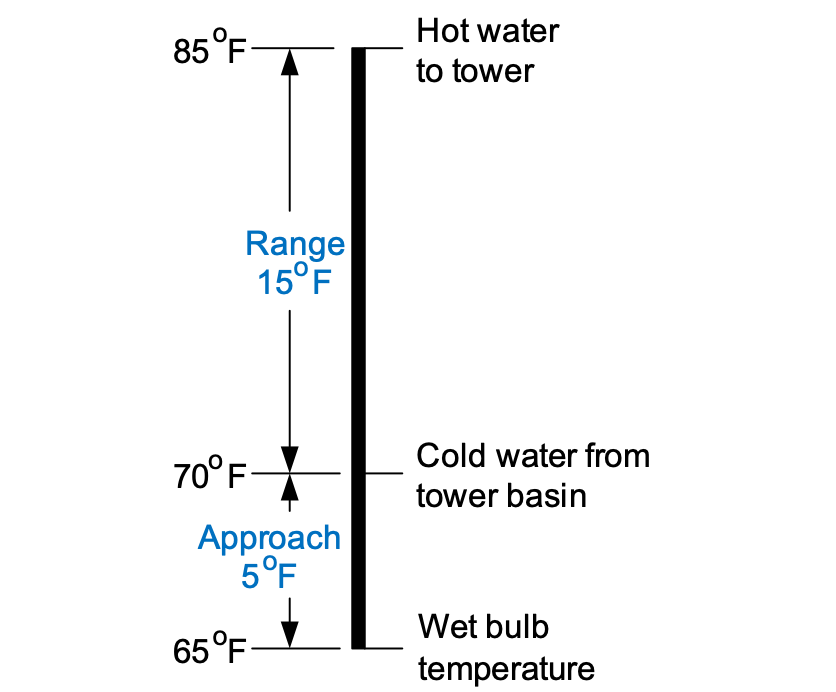
Figure 6.21. Graphical outline of range and approach temperatures. (Reference 1)
The closest approach to wet bulb temperature that can economically be reached with a modern tower is about 4°F, with a typical value of 10°F.
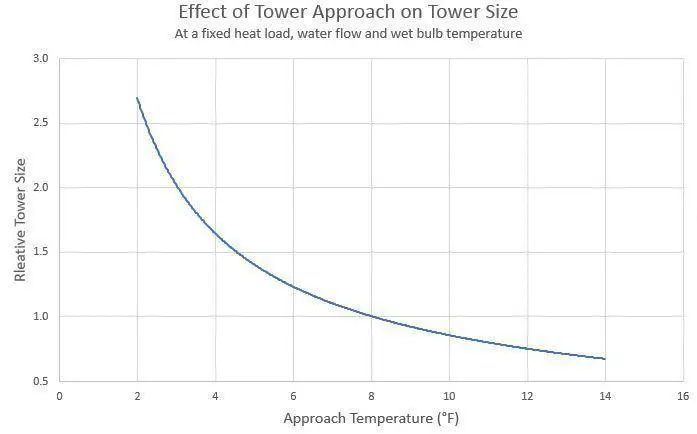
Figure 6.22. Chart of relative cooling tower size vs approach temperature for general applications.
Illustration courtesy of Rich Aull Consulting.
The data needed to calculate heat transfer by air cooling and evaporation has been compiled in a psychrometric chart. One version is shown below.
Psychrometric charts contain a large amount of data and can be difficult to interpret. Appendix 6-1 outlines how to evaluate this data.
Reference 8 provides a direct example of how to calculate cooling tower evaporation from psychrometric data, but a simpler equation is available that provides good approximations.
E = (ƒ * R * ΔT)/1000 | Eq. 6-1
E = Evaporation in gpm
R = Recirculation rate in gpm
ΔT = Temperature difference (range) between the warm and cooled circulating water (oF)
ƒ = A correction factor that accounts for evaporative and sensible heat transfer, where ƒ (average) is often considered to be 0.75 to 0.80, but will rise in summer and decline in winter.
The factor of 1,000 is the approximate latent heat of vaporization (Btu/lb) of water at ambient conditions.
As an illustration of this calculation, consider a cooling tower at the following conditions:
For these parameters, E = 1,800 gpm. Thus, the required cooling is achieved by just 1.2% evaporation of the recirculating water, with 20% sensible heat transfer.
Evaporation in cooling towers raises the concentration of dissolved and suspended solids. The common vernacular in the industry for the concentration factor is cycles of concentration (COC). COC can be monitored by comparing the levels of a very soluble ion, such as chloride, in the recirculating (R) water and makeup (MU). However, this procedure requires laboratory analyses. A typical substitute is online-specific conductivity monitoring of the two streams, which can be programmed to automatically bleed off some recirculating water when it becomes too concentrated. A common COC range is 4 to 6. The water savings by increasing blowdown beyond this range become minimal, as the graph below clearly shows.
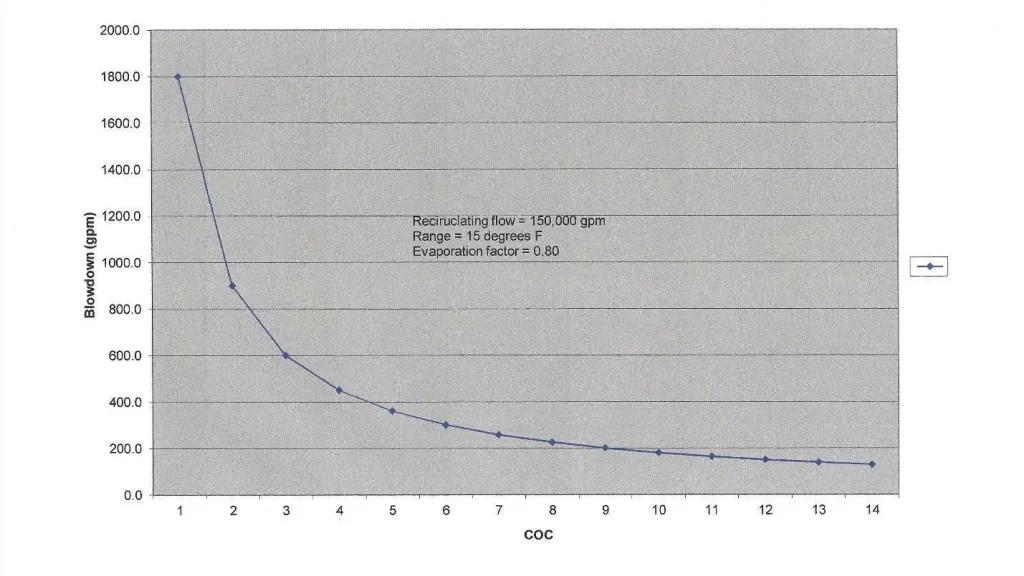
Figure 6.24. Cycles of concentration vs. blowdown rate for the heat transfer example outlined earlier.
COC, or perhaps more accurately, allowable COC, varies from tower to tower depending upon many factors, including makeup water chemistry, heat load, effectiveness of chemical treatment programs, and possible restrictions on water discharge quality or quantity. In arid locations, COC may need to be high, but chemistry control becomes more difficult.
A straightforward set of equations is available to reasonably calculate the blowdown (BD) and makeup requirements from a tower when the evaporation is known, and allowable COC has been determined.
BD = E/(COC – 1) | Eq. 6-2
MU = E + BD + D + L | Eq. 6-3
Regarding Equation 6-3, it has been noted that some water escapes the tower as drift (D), but in towers with state-of-the-art drift eliminators, drift is quite small. Leaks in the cooling system are referred to as losses (L), which also contribute to blowdown. In older systems, leaks from corrosion of piping and other equipment may be significant.
Corrosion, Scale, and Biofouling Control in Cooling Systems discusses water treatment technologies to control scaling and fouling in cooling towers and the systems they supply, but the following section outlines a physical method for suspended solids control.


Suspended solids enter cooling towers in the makeup water, and as dust and other airborne debris. A prime example of airborne debris in many locations is cottonwood seeds, which readily foul in-line equipment filters. As with dissolved solids, particulates “cycle up” in the recirculating water, and can settle in low velocity areas of the cooling system, including the tower basin.
Side stream filtration may effectively remove suspended solids in both open and closed cooling systems. Figure 6.25 shows two common filter locations.
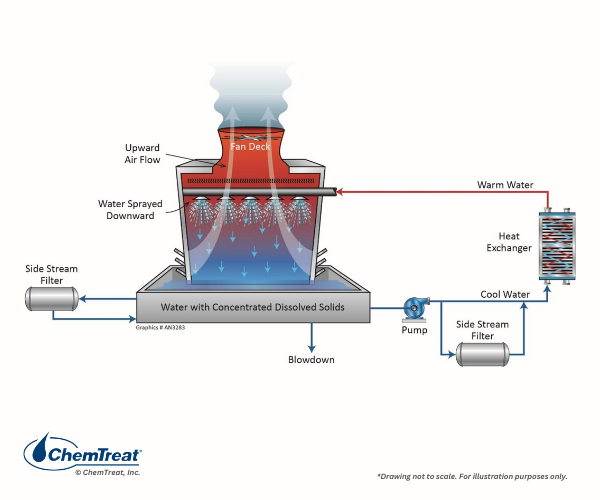
Figure 6.25. At left is a common “kidney-loop” sidestream filter arrangement on a cooling tower basin. An alternate location is the recirculating pump discharge shown at the lower right.
The table below outlines four of the most common side stream filter technologies.
Table 6-2. Sidestream Technologies
Source: Sidestream Filtration for Cooling Towers (energy.gov)
| Filter Type | Particle Removal Level | Basic Filtering Mechanism | Applications | Notes |
|---|---|---|---|---|
| Centrifugal Separator | 40–75 microns, fine to coarse inorganics with a specific gravity of 1.62 or greater | High velocity water is fed in a circular pattern that [forces] heavier particles down and out of the system | Best for removal of large, heavy particles | Minimal maintenance required |
| Automatic Screen Filter | Down to 10 microns | Water flows through a rigid screen, where large particles are trapped and then removed from the system | Best for systems that cannot be interrupted such as industrial processes and hospitals | Self-cleaning mechanism is automatic and requires little down time |
| Plastic Disc Filter | Down to 10 microns | Grooved, stacked plates trap particles as water moves through the discs | Appropriate where removal of both solids and organics are required | Self-cleaning mechanism is automatic and requires little down time |
| Sand Filters | Down to 10 microns for pressure sand filters; to 0.45 microns for high-efficiency sand filters | Layers of granulated sand trap particles | Best for applications that require removal of fine and low-density particles | Supplemental chlorine feed may be needed because sand filters can promote microbiological growth |
A pressure sand filter is shown below.
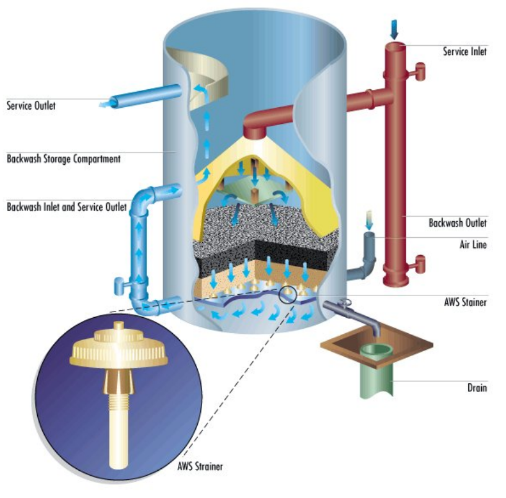
Figure 6.26. A pressure, sand filter for sidestream filtration.
Courtesy of Marmon Industrial Water.
Choosing the optimum filtration method may require a careful evaluation of particulate sources and extent of ingress.
Aside from periodic visual inspections of cooling tower components for scaling, fouling, or damage, regular operating data analyses are important to ensure reliable tower performance. The list below outlines important data for each test.
Periodic comprehensive evaluations by a reputable vendor are also recommended. The Cooling Technology Institute can supply information regarding qualified firms.
Several cooling tower modifications or alternative technologies have emerged over time.
An evaporative condenser (see Figure 6.27 below) consists of a conventional cooling tower with a naked (no outer shell) heat exchanger located inside the tower.
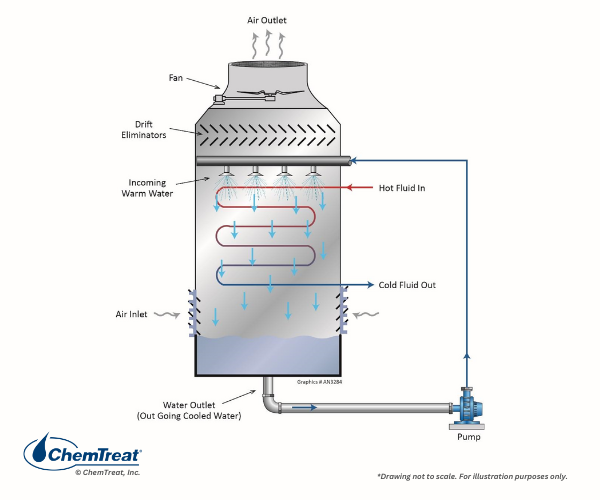
Figure 6.27. An Evaporative Condenser.
Placing the condenser inside the cooling tower reduces the space required to cool the refrigerant in a chiller air-conditioner system. However, this arrangement presents challenges in minimizing corrosion and deposition on the tubes. Cleaning, particularly inside bundled tubes, is challenging.
Proper spray header design and positioning are crucial to evenly distribute water over the tubes. Regular inspection and maintenance of spray headers nozzles is important.
A variation of this design is the wet-surface air cooler (WSAC®), as shown in Figure 6.28.
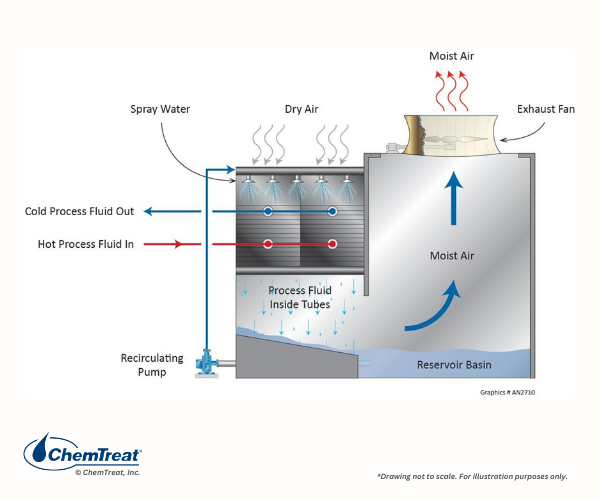
Figure 6.28. WSAC® Design
Cooling water and air travel co-currently in this design, where the configuration provides a large surface area for cooling and reduces the amount of water lost to evaporation.
Air-cooled condensers (ACC) were originally designed for power plant turbine exhaust steam cooling in arid applications but are now being adopted in other locations.
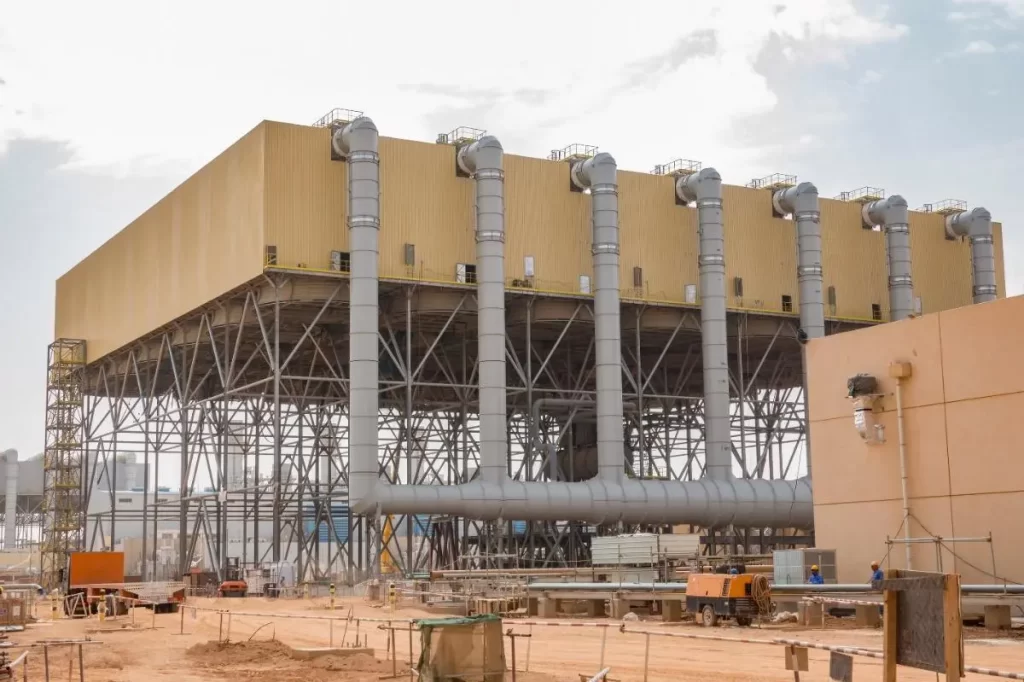
Figure 6.29. Air-cooled condenser.
These units utilize ambient air for cooling, and thus steam condensation is by sensible heat transfer only.
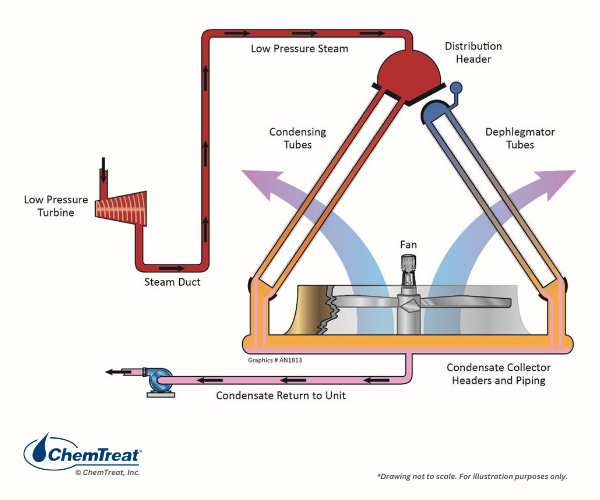
Figure 6.30. Basic diagram of a power plant ACC process.
As Figure 6.30 illustrates, ACCs must be quite large to provide the necessary cooling. This is clear when comparing air’s density and heat capacity to those of water. ACCs can only cool steam to temperatures approaching the ambient-air dry bulb, not wet bulb. Thus, during warm months the turbine efficiency is significantly lower than for a comparable unit with a cooling tower and water-cooled condenser.
Fin-fan cooling, a smaller-scale process, is commonly used in plants to condition liquid water and process streams.
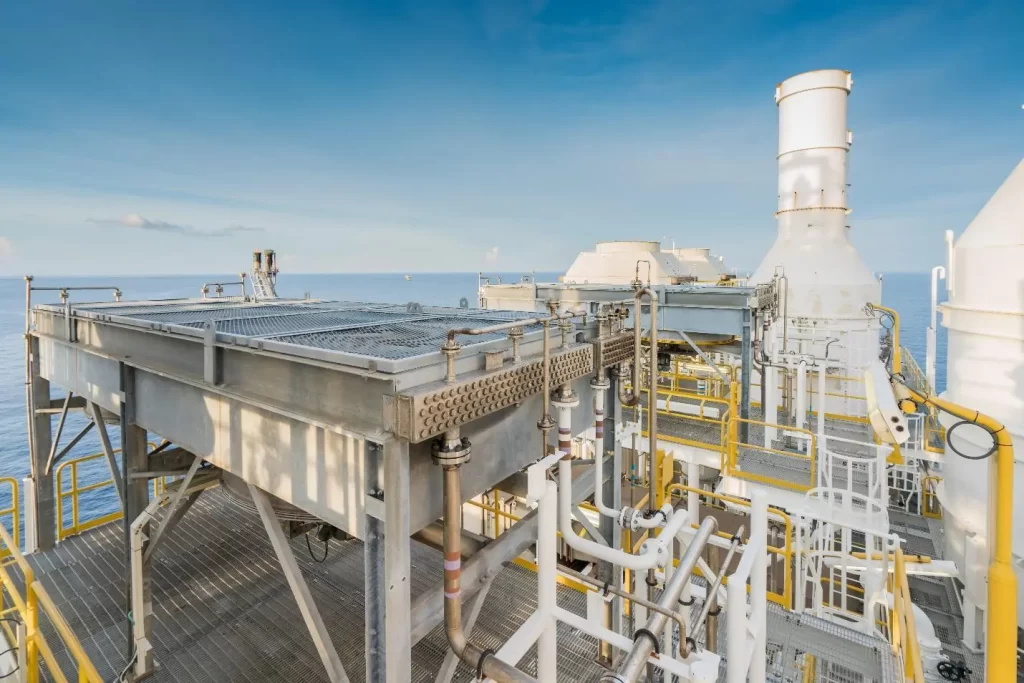
Figure 6.31. Fin-fan cooler.
These coolers typically have many small diameter tubes, which can become clogged with solids if chemistry control is inadequate.
Air washers are present in some industries, such as textile spinning mills, to control air temperature and humidity, and to maximize production and remove particles from the air.
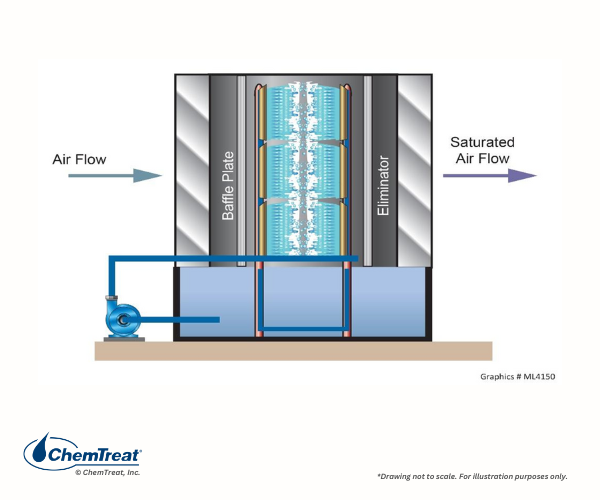
During summer when evaporation is enhanced, the units may operate as a once-through system. During winter, the system may return to open recirculation similar to a cooling tower, necessitating blowdown.
Many plants have numerous heat exchangers that are embedded within one or more closed cooling water systems. These auxiliary “closed” heat exchangers reject heat to the primary open recirculation cooling system.
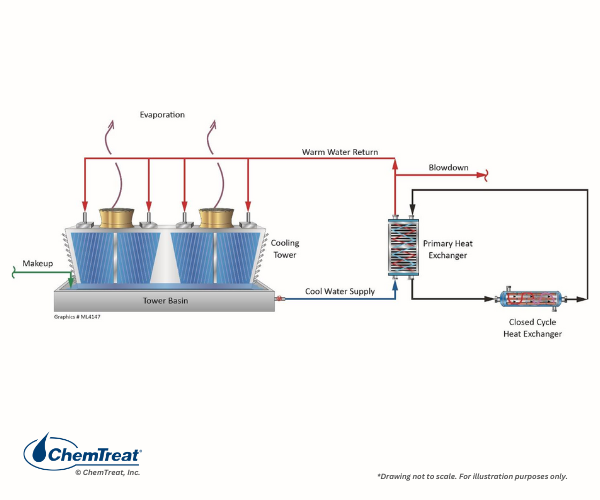
Figure 6.33. General schematic of a primary open-recirculating and secondary closed cooling system arrangement.
A closed system is defined as a loop which has little or no evaporation, and where makeup requirements do not exceed 5–15% of volume each year.
Systems are often designed with a head tank for water makeup and to absorb volume changes per temperature and load fluctuations. This arrangement can allow oxygen to enter the cooling water, which, of course, influences the corrosion potential. Some closed systems may have a pressurized expansion or bladder tank to maintain constant water pressure. Makeup vessels or tanks are often located at the highest point in a closed loop to serve as an air release outlet for non-condensable gases that might otherwise accumulate in the system and may cause corrosion and pump cavitation.
Examples of industrial and commercial closed cooling applications include:
The figure below shows the outline of a basic chilled water system.
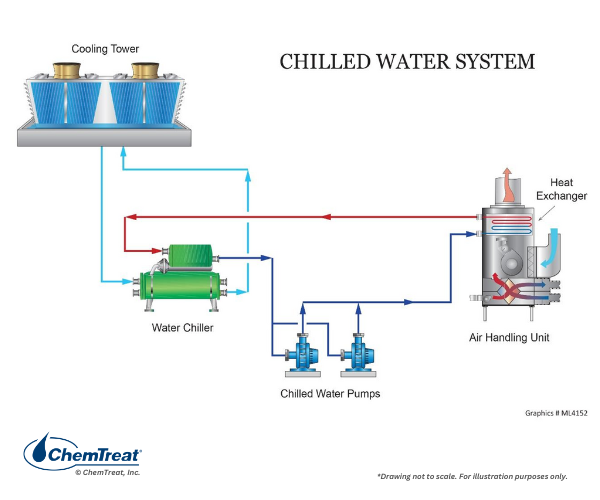
Figure 6.34. Basic flow diagram of a chilled water system. A common chilled water temperature range is 40 to 45o F.
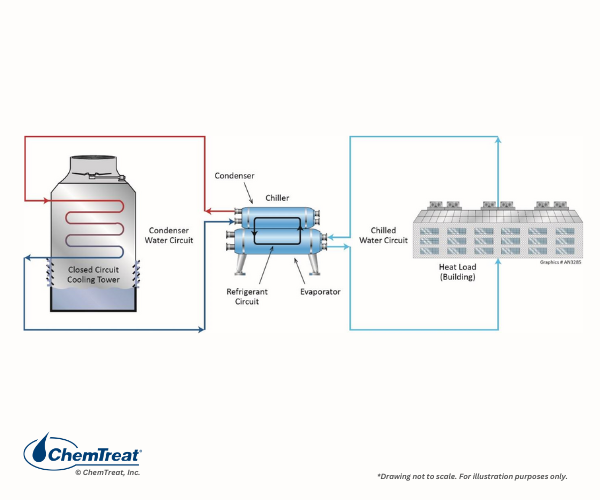
A variation of this design is shown below, with a closed cooling tower serving as the primary cooling circuit.
Most closed systems feature a side-stream pot feeder of limited capacity, equipped with inlet and outlet isolation valves to facilitate batch chemical dosing. Some systems are enhanced with a combination of a feeder and side-stream filter to remove metal corrosion products that inevitably form during operation. A filter can be particularly valuable for some applications, such as the automated elders at automobile assembly plants, which have small-bore, serpentine cooling lines in the welder heads. Particulate accumulation (and fouling or scaling) can be problematic with this application.
Some closed water loops require high-purity makeup water, or condensate. An example is a steel mill continuous casting cooler where the heat transfer rate is extremely large (106 Btu/ft2/hr). Corrosion or fouling that restricts heat transfer can be extremely detrimental and dangerous if “breakout” of molten steel occurs during the casting process.
Thermal Energy Storage (TES) is a technique utilized at some municipal central heating and cooling facilities.
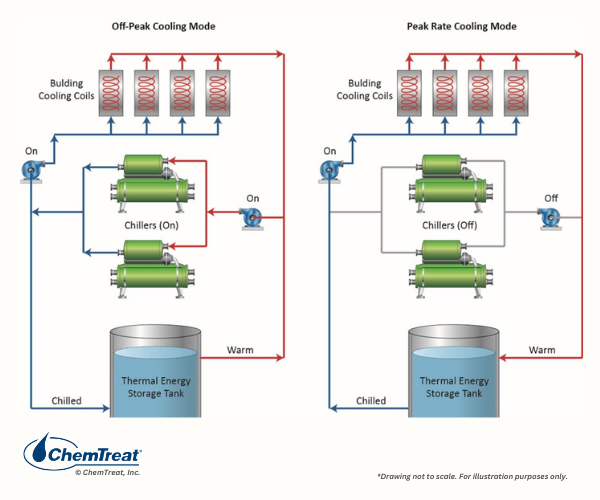
Figure 6.36. TES schematic.
The chilled media can be water, ice, or frozen brine, with storage capacities reaching millions of gallons. The water is chilled at night during off-peak electrical demand when power costs are lower.
Hot water closed loops are commonly used to heat buildings. Many configurations return water to the heater, increasing efficiency. Hot water is often utilized for energy transfer between industrial processes at large industrial facilities. For example, in ethylene cracking units, a closed heat exchanger quenches the cracked ethylene gas, then transfers the heat to incoming hydrocarbon feed stock. This thermal loop is termed a “Hot Water Belt.” The cooled water from the hydrocarbon heat exchanger returns to the ethylene cracker.
Heat transfer can be defined as the conveyance of energy and entropy from one point to another. When designing a heat transfer system, engineering and construction costs must be balanced against operating and maintenance costs. Sometimes expensive alloys or generous equipment size are worth the extra cost to prolong unit life and boost efficiency. In other cases, basic materials and design are sufficient.
Perhaps the most common heat exchanger design is the shell-and-tube configuration. A U-bend, two-pass exchanger is shown below.
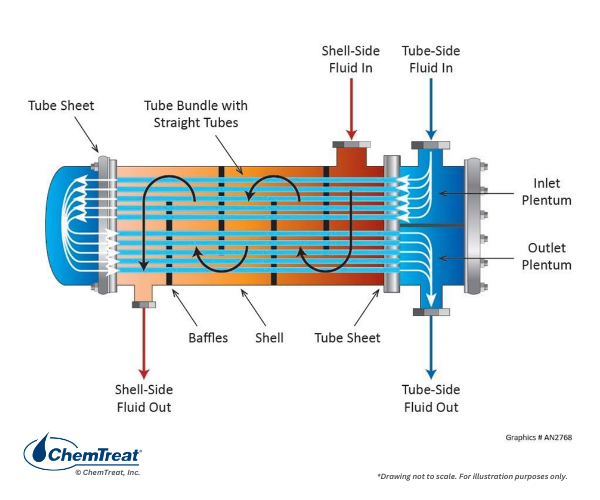
Figure 6.37. Shell-and-tube heat exchanger design.
Such exchangers are common for liquid-to-liquid heat transfer when only one or neither of the fluids is water. This handbook, with its focus on water treatment, considers exchangers with water as the primary coolant, and where the water flow is through the tubes with the process fluid on the external tube surfaces. The design in Figure 6.37 is co-current with the coolant and process fluid flowing in the same direction. Note the baffle plates in the exchanger to enhance flow mixing and heat transfer. Two-pass heat exchangers are popular because they can provide greater cooling in a smaller amount of space than single-pass coolers.
A counter-current exchanger is shown below.
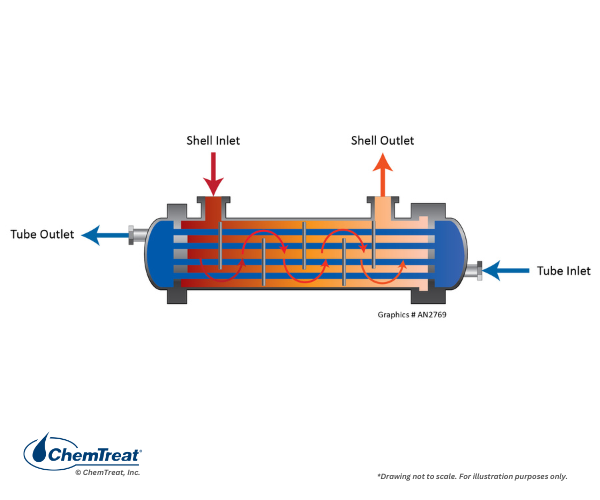
Figure 6.38. Counter-flow heat exchanger.
This design is often preferred because of lower thermal stress on the equipment, as the cooling water warms considerably before entering the highest-heat zone.
An interesting variation on this design is the steam surface condenser, which were prominent at large coal and nuclear power plants, and are still prevalent at many combined cycle power plants.
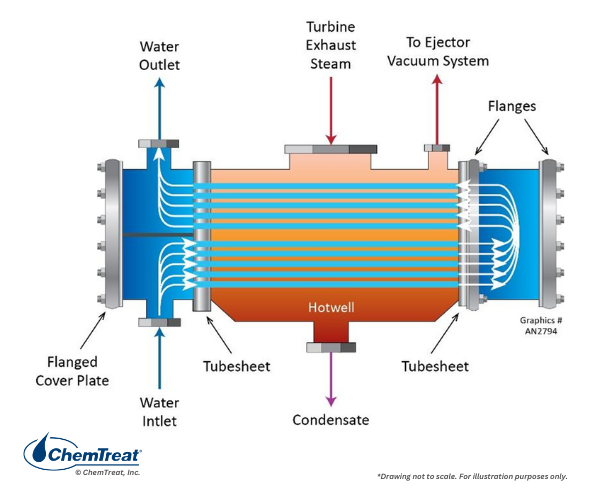
Figure 6.39. Two-pass steam surface condenser.
The incoming turbine exhaust steam is typically of 90% or greater quality. The heat exchanger, with thousands of tubes, converts the steam to liquid for return to the boiler. Condensation improves the thermodynamic efficiency of the power generation process by nearly a third. However, condensation generates a very strong vacuum when the steam collapses to water. The vacuum draws air through small openings in the condenser shell or other areas. If the air is allowed to accumulate, it will coat the tubes and greatly reduce heat transfer. Thus, surface condensers are typically equipped with an air removal compartment that is continuously exhausted by vacuum pumps.
Older coal-fired plants often had vertically aligned shell-and-tube exchangers for feedwater heating. This orientation is practical where horizontal space is limited.
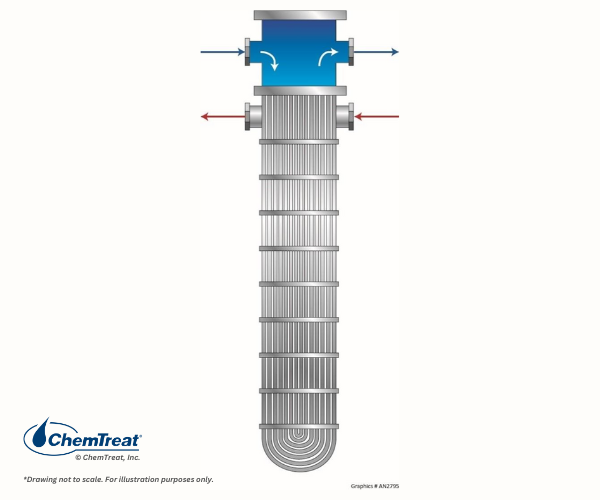
Figure 6.40. Vertical heat exchanger.
Suspended solids in the water may accumulate at the bottom of a vertical heat exchanger if flow is insufficient to keep solids in suspension. Periodic removal of the deposits may be necessary to prevent tubes from becoming blocked with material.
For water cooled shell-and-tube heat exchangers, the shell is often carbon steel, with higher-grade materials for the tubes. In a steam condenser, potential tube materials include admiralty brass (70% copper, 29% zinc with minor additional elements), 90-10 copper-nickel, 70-30 copper-nickel, and, more recently, the 300-series stainless steels. For systems using cooling water with high chloride concentrations, tube materials often include titanium or super-ferritic stainless steels such as SeaCure®. Heat exchangers in refineries and chemical plants may require specialty alloys because of specific corrosive agents and high temperatures within the process streams. For example, sulfides are highly corrosive to many metals, and strong acids or caustics require special handling.
Another common design is the plate-and-frame heat exchanger.
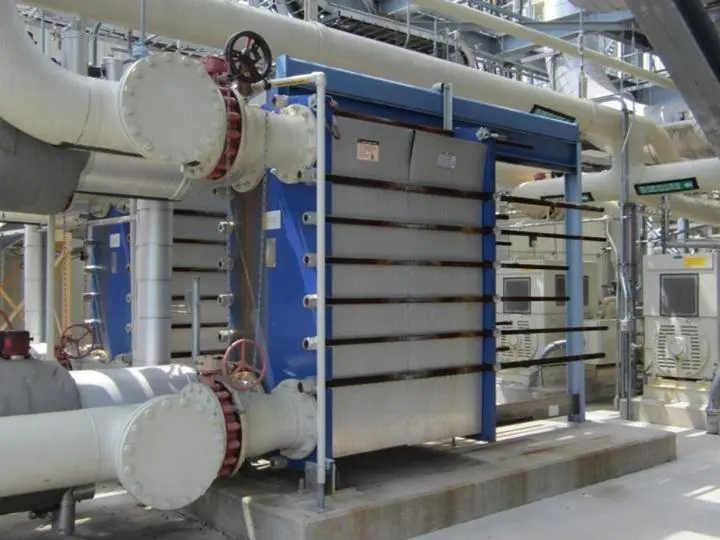
Figure 6.41. Plate heat exchanger.
These units offer a smaller footprint and lower cost than shell-and-tube exchangers. The figure below illustrates a basic flow path.
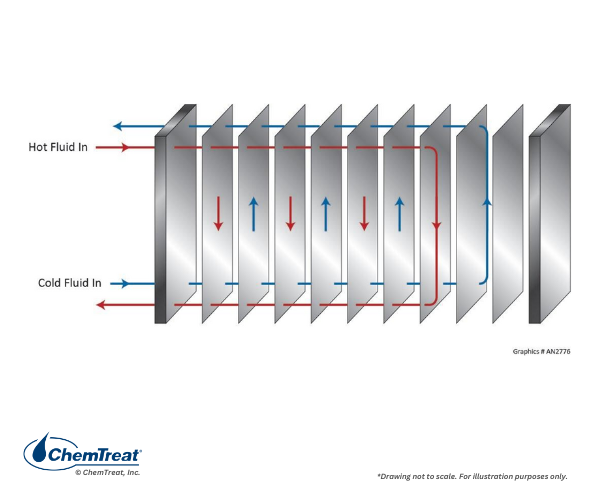
Figure 6.42. Basic plate exchanger flow path.
One disadvantage is that closely spaced plates create areas of low fluid velocity where suspended solids can settle. Some exchangers may have corrugated plates to enhance fluid mixing, which can present cleaning challenges that require disassembly of the exchanger.
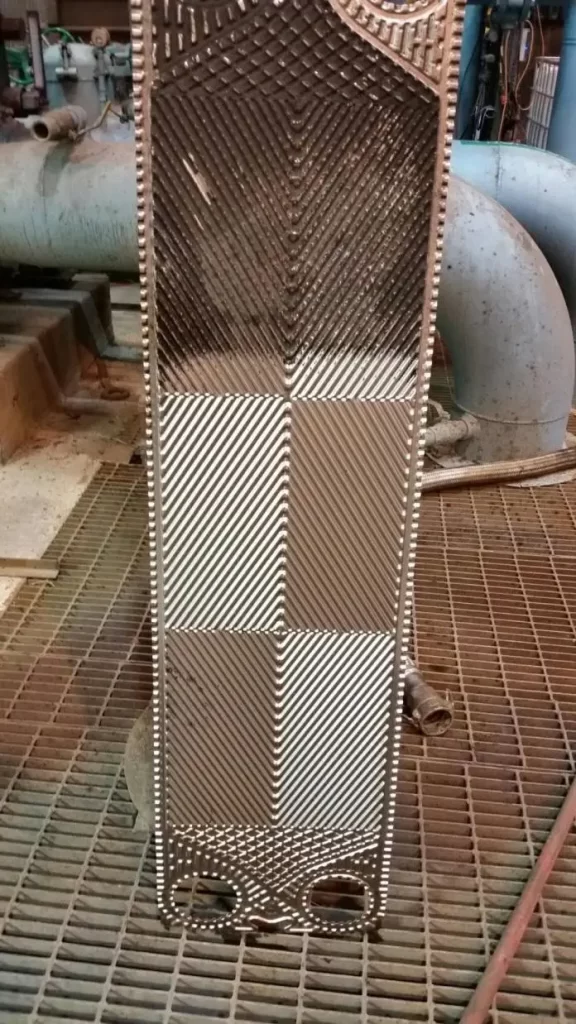
Figure 6.43. A corrugated plate from a plate and frame exchanger. Lower part of the plate already cleaned by water jet washing, upper part uncleaned with fouling clearly visible.
Stainless steel is a common material for plate exchangers, but more exotic materials may be required in high-stress or corrosive applications.
Other heat exchangers may be spiral or helical. A diagram of each is provided below.
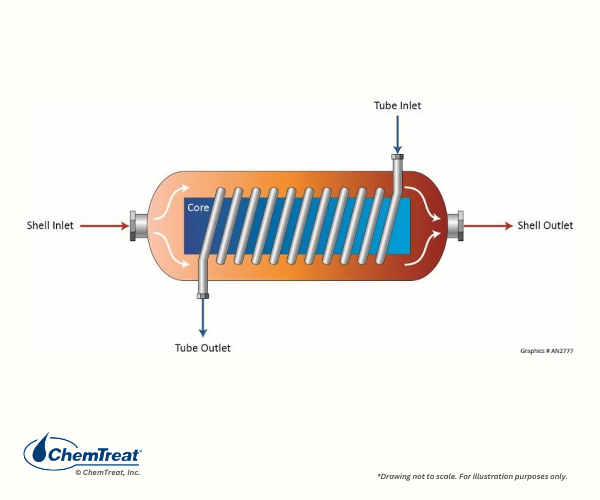
Figure 6.44. A helical heat exchanger.
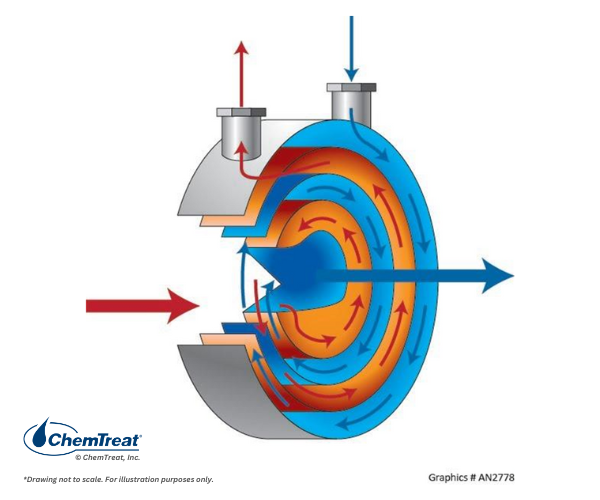
Figure 6.45. A spiral heat exchanger.
These figures illustrate heat exchangers that provide a physical boundary between two fluids. In some applications, no boundary exists. A primary example is direct steam injection. The steam is subsequently collected as condensate later in the process. However, the condensate may contain impurities that require removal before return to the boiler.
The three general modes of heat transfer are convection, conduction, and radiation, as discussed in Fundamentals of Industrial Boilers and Steam Generation Systems. For most of the heat exchangers outlined above, conduction and convection are the primary heat transfer methods. Although heat transfer is complex, some fundamental formulas make the process easier to understand. If heat is moving from one fluid to another across a barrier, you can determine the total amount transferred as follows:
(Q/t)total = U*A*ΔTtotal | Eq. 6-4
The key variable in Equation 6-4 is U. When fluid flows through a tube, pipe, or along a plate, even if the bulk flow is turbulent, a thin, laminar sublayer forms at the material surface which influences heat transfer. Accordingly, for a clean surface, the equation for U becomes:
1/U = 1/h′ + 1/h″ + xw/k | Eq. 6-5
An example of heat transfer from steam condensing on a 2”, Schedule 40 carbon steel pipe is outlined in Elementary Chemical Engineering.11 All details are not repeated here, but it is worth noting that h′ (water film) is given as 500 Btu/hr (ft2) (oF), h″ (steam side) is given as 2,000 Btu/hr (ft2) (oF), and xw/k is 0.00046 (hr) (ft2) (oF)/Btu, where k for carbon steel is listed as 26 Btu/hr (ft2) (oF/ft). Taking the inverse of the first two and adding these numbers to the third value (and adjusting slightly for internal and external pipe surface area differences) gives a U value of 346 Btu/hr (ft2) (oF). For this example, with a single pipe 10 feet long and LMTD of 91o F, per Equation 6-4 the heat transfer to the cooling water is 170,000 Btu/hr.
A key observation from this example is that the heat transfer through the steam-side and the pipe wall are roughly equivalent, but heat transfer through the water film is considerably lower. Thus, heat exchangers are often designed to maximize turbulent flow (within constraints on pumping requirements and metal resistance to erosion-corrosion) to reduce the laminar sub-layer thickness. For exchangers with liquid on both sides of the tubes or plates, the film heat transfer resistance increases. These factors are very important when designing the unit. If the process fluid is something other than water or steam, the calculations become more complex.
An important criterion for selecting heat exchanger materials is thermal conductivity. The data below offers some selected values from common heat exchanger materials.
Table 6-3. Thermal conductivities of some common heat exchanger materials.
Information provided by Dan Janikowski, Plymouth Tube Company per Heat Exchange Institute (HEI) data.
| Metal | Thermal Conductivity at 68o F (or near)(Btu/(hr) (ft2) (o F/ft) |
|---|---|
| Carbon Steel | 27.5 |
| Admiralty Brass (70 Cu, 29 Zn) | 64 |
| 90-10 Cu-Ni | 26 |
| 70-30 Cu-NI | 17 |
| 304 and 304L Stainless Steel | 8.6 |
| 316 and 316L Stainless Steel | 8.2 |
| Titanium (Grade 2) | 12.7 |
The table illustrates the much higher conductivity of admiralty brass compared to carbon steel and stainless steel. For this reason, in the middle of the last century, admiralty brass was a common selection for condenser and feedwater heater tubes in coal-fired power units. Thick tube walls were possible; designed to provide long service life. However, it became increasingly apparent that gradual copper corrosion allowed transport of the corrosion products to steam turbines, which deposited on the turbine blades and reduced efficiency. Many plant staffs replaced the admiralty tubes with stainless steel to eliminate this problem. Unfortunately, when this modification was made in some condensers, the stainless steel tubes began to suffer from waterside microbiologically-induced corrosion (MIC). Copper ions that leached from the admiralty tubes were toxic to microbes, whereas the steel did not offer the same protection.
One important consideration for thermal conductivity is that many metals tend to form an oxide layer during service. The layer may be more or less protective depending on the environment and the metal. Copper alloys form an oxide patina, which is considerably more insulating than the base metal. This is another factor that must be considered during heat exchanger design.
Expanding on Equation 6-5, the equation below illustrates the influence of deposition on either side of the metal surface.
1/U = 1/h′ + 1/h″ + xw/k + 1/h′d + 1/h″d | Eq. 6-6
The last two terms account for deposition or film formation on each side of the tube wall or plate.
Mineral and microbiological deposits have low heat transfer coefficients as shown in the table below.
Table 6-4. Thermal conductivity of three common water-side deposits.
Information provided by Dan Janikowski, Plymouth Tube Company.
| Foulant or Scale | Thermal Conductivity (Btu/(hr) (ft2) (o F/ft) |
|---|---|
| Calcium carbonate | 1.25 |
| Silica | 0.8 |
| Biofilm or stagnant water | 0.36 |
Even a thin deposit layer will significantly reduce heat transfer. Note the confirmation of the insulating effect of a stagnant water layer. Porous biofilms can induce under-deposit corrosion, which may lead to premature failures and unit outages.
When heat is exchanged between two liquids with no phase change by either, the amount of heat lost by the warmer liquid is balanced by that gained by the coolant. The energy exchange is all sensible heat transfer, and, excluding minor losses, can be described by the following standard equation.
Q/t = ṁ *Cp*∆T | Eq. 6-7
If one of the fluids condenses from a vapor, then the latent heat (H) is also transferred, and Equation 6-7 expands to:
Q/t = ṁ*Cp*∆T + ṁ*ΔH | Eq. 6-8
The importance of latent heat recovery continues to have a growing influence on plant design. Consider the many coal-fired units constructed in the last century. The fundamental process involves the production of superheated steam to drive a turbine generator. (See Fundamentals of Industrial Boilers and Steam Generating Systems.) The turbine exhaust steam is cooled to liquid in the condenser for return to the boiler. Condensation significantly improves the net thermodynamic efficiency of the unit, but most of the steam’s latent heat is still lost to the cooling water. The best drum units are only capable of approximately 35% net efficiency, and even the most modern ultra-supercritical units can achieve 45% efficiency at most. Co-generation and combined heat and power (CHP) units may achieve up to 80% net efficiency. A common co-gen configuration uses superheated steam to drive a turbine for electricity production, but with steam extraction before complete loss of superheat. The extracted steam feeds process heat exchangers, in which the latent heat is also utilized. This design is becoming increasingly common at industrial facilities to produce electricity internally and maximize steam heat efficiency.
Specification sheets are typical for new heat exchangers, and an example from the Tubular Exchange Manufacturers Association (TEMA) is shown below.
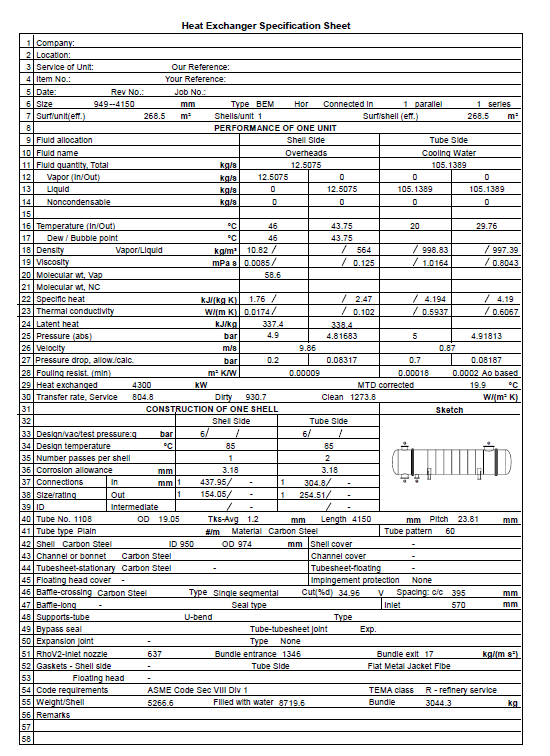
Figure 6.46. Specification sheet for a shell-and-tube heat exchanger.
When units are placed into service, it is important to collect all relevant operating data, as this is when the exchanger is at its most pristine with maximum heat transfer efficiency. Typically, the data will not exactly match the specification sheet, but it serves as the baseline for the future. Important data for inlet and outlet streams is outlined in Figure 6.46 and includes the following:
Accurate process flow diagrams (PFDs) and process and instrument diagrams (P&IDs) that comprehensively detail the equipment and piping within a unit operation, including flow rates, pressures, and temperatures at full capacity, are essential for effective process management. For plants such as refineries, chemical manufacturing, and other similar facilities, a large number of diagrams are necessary. A lack of documentation for piping and equipment modifications is a common mistake at many plants. This becomes even more problematic when changes are made to the underground piping without proper documentation.
Common issues that affect heat exchangers materially and/or performance-wise include:
Another common error, particularly at plants with many heat exchangers, is to monitor all exchangers superficially and overlook data from individual units that suggest a serious problem. Allocating resources for personnel to better focus on heat exchanger operation can be beneficial in finding and correcting problems before they become major issues.

Tremendous advancements have been made in the development of online instrumentation and data-analysis algorithms to track equipment performance, provide readings to control room and auxiliary operators, and in some cases make automatic adjustments to equipment. The costs can often be justified by early identification of unfavorable conditions to allow prompt corrective action that prevents efficiency loss or even equipment failure.
Important information that data systems collect include:
The power industry continues to see significant changes. Coal-fired power generation has been on a steep decline in many areas of the world due to climate concerns and efforts to reduce CO2 emissions. Besides renewable energy technologies, combined cycle power generation is taking the place of coal units. A significant portion of combined cycle power is produced by heat recovery steam generators (HRSGs) and accompanying steam turbines, whose heat source is combustion turbine exhaust gas. While ACCs are becoming more common for steam turbine exhaust cooling, many HRSGs still have water-cooled condensers. For plants with these condensers, several measurements are very effective for monitoring performance.
The three critical temperature measurements for evaluating condenser performance are cooling water inlet and outlet, and condensed steam that collects in the hotwell. Of course, the inlet and outlet temperatures will always undergo seasonal changes, which can mask problems. The key measurement is the TTD, which for condensers is the condensed steam temperature minus the cooling water outlet temperature. When TTD data are collected over time at consistent unit load, preferably full load, the readings should remain steady if the condenser is operating properly. Water-side fouling, scale buildup, or excess air leakage on the steam side reduce heat transfer and increase TTD.
Several years ago, the Heat Exchange Institute (HEI) developed calculations to detemine the condenser cleanliness factor (CF) that utilize temperature measurements, condenser tube material specifications, total and plugged tube counts, as well as tube dimensions such as length, diameter, and wall thickness. These methods also consider the number of passes—typically one or two—and the cooling water flow rate to determine the condenser cleanliness factor (CF). The program calculates a design heat transfer coefficient (Ud) and an actual heat transfer coefficient (Ua), where Ua/Ud * 100 is the CF in percentage. Theoretically, the CF should be around 85% for a clean condenser with no plugged tubes, but the value is particular to each individual unit. Therefore, data should be collected at condenser startup or after tube cleaning to serve as the baseline for continued monitoring. The program can be very effective at detecting gradual loss of heat transfer from water-side scaling or microbiological fouling to excess air in-leakage on the steam side.
The enormous decrease in volume when turbine exhaust steam converts to water in the condenser induces a very strong vacuum. In winter with cold cooling water, the vacuum may reach around 1 inch (Hg) above absolute (-29.92 inches gauge pressure at sea level). This value is known as condenser backpressure. It increases in spring and summer, so power plant cooling systems often use multiple pumps to boost water flow during warmer months. Backpressure is a valuable tool for tracking condenser performance, recognizing that it will rise by perhaps two to four inches from winter to summer. If condenser fouling induces higher backpressures, fuel requirements and costs may increase dramatically. Additionally, turbines are designed to shut down if backpressure exceeds the typical summer maximum. A unit trip during a summer peak can be very expensive.
Of note, it is the strong vacuum generated in the condenser that pulls in ambient air at structural irregularities or failures at the condenser or any surrounding auxiliary systems. A sudden crack in the condenser shell is a common occurrence. If the air ingress is greater than can be handled by the air-removal system, the excess air will form pockets in the condenser and significantly restrict heat transfer. A good CF program will often detect such problems quickly.
Condenser fouling or scaling impedes fluid flow and will appear as an increase in circulating pump discharge pressure. Generally, the discharge pressure ranges from 20 to 80 psi depending on the equipment served and elevations. Conversely, over time circulating pump flow tends to decrease because of impellor degradation. Historically, obtaining precise measurements of such large flows in the field posed significant challenges; however, recent advances in instrumentation have effectively addressed this issue.
This chapter outlined important fundamental heat exchanger aspects at industrial facilities and power plants. Many exchanger varieties are available, with numerous metallurgies possible. These details are very important when selecting and implementing chemical treatment programs to protect cooling systems from corrosion, scaling, and microbiological fouling.
ChemTreat is committed to providing expert water treatment solutions. We maintain environmental and quality management systems certifications to prove our expertise as a water treatment company and provide customized solutions for every client. If you are looking to increase the efficiency and reliability of your water cooling systems, contact ChemTreat today to get in touch with a local representative to learn how you can transform your operations.

Senior Technical Staff Consultant
Tom Nix is a trusted technical expert with decades of industrial water treatment experience. Nix is well-versed in a wide range of applications, including influent clarification, softening, demineralization, reverse osmosis, cooling water treatment, low- and high-pressure boiler treatment, and wastewater treatment. He holds a B.S. in Environmental Biology from the University of Texas at Austin.

President of Buecker & Associates, LLC
Brad Buecker is president of Buecker & Associates, LLC, and most recently he served as Senior Technical Publicist with ChemTreat, Inc. He has over four decades of experience in or supporting the power industry, much of it in steam generation chemistry, water treatment, and air quality control. Buecker has a B.S. in Chemistry from Iowa State University. He has authored or co-authored over 250 articles for various technical trade magazines and has written three books on power plant chemistry and air pollution control. He serves on the Editorial Advisory Board of Water Technology and is a member of the ACS, AIChE, AIST, ASME, NACE (now AMPP), and the Electric Utility Chemistry Workshop planning committee.
The ChemTreat Water Essentials Handbook would not have been possible without the contributions of many people. See the full list of contributors.